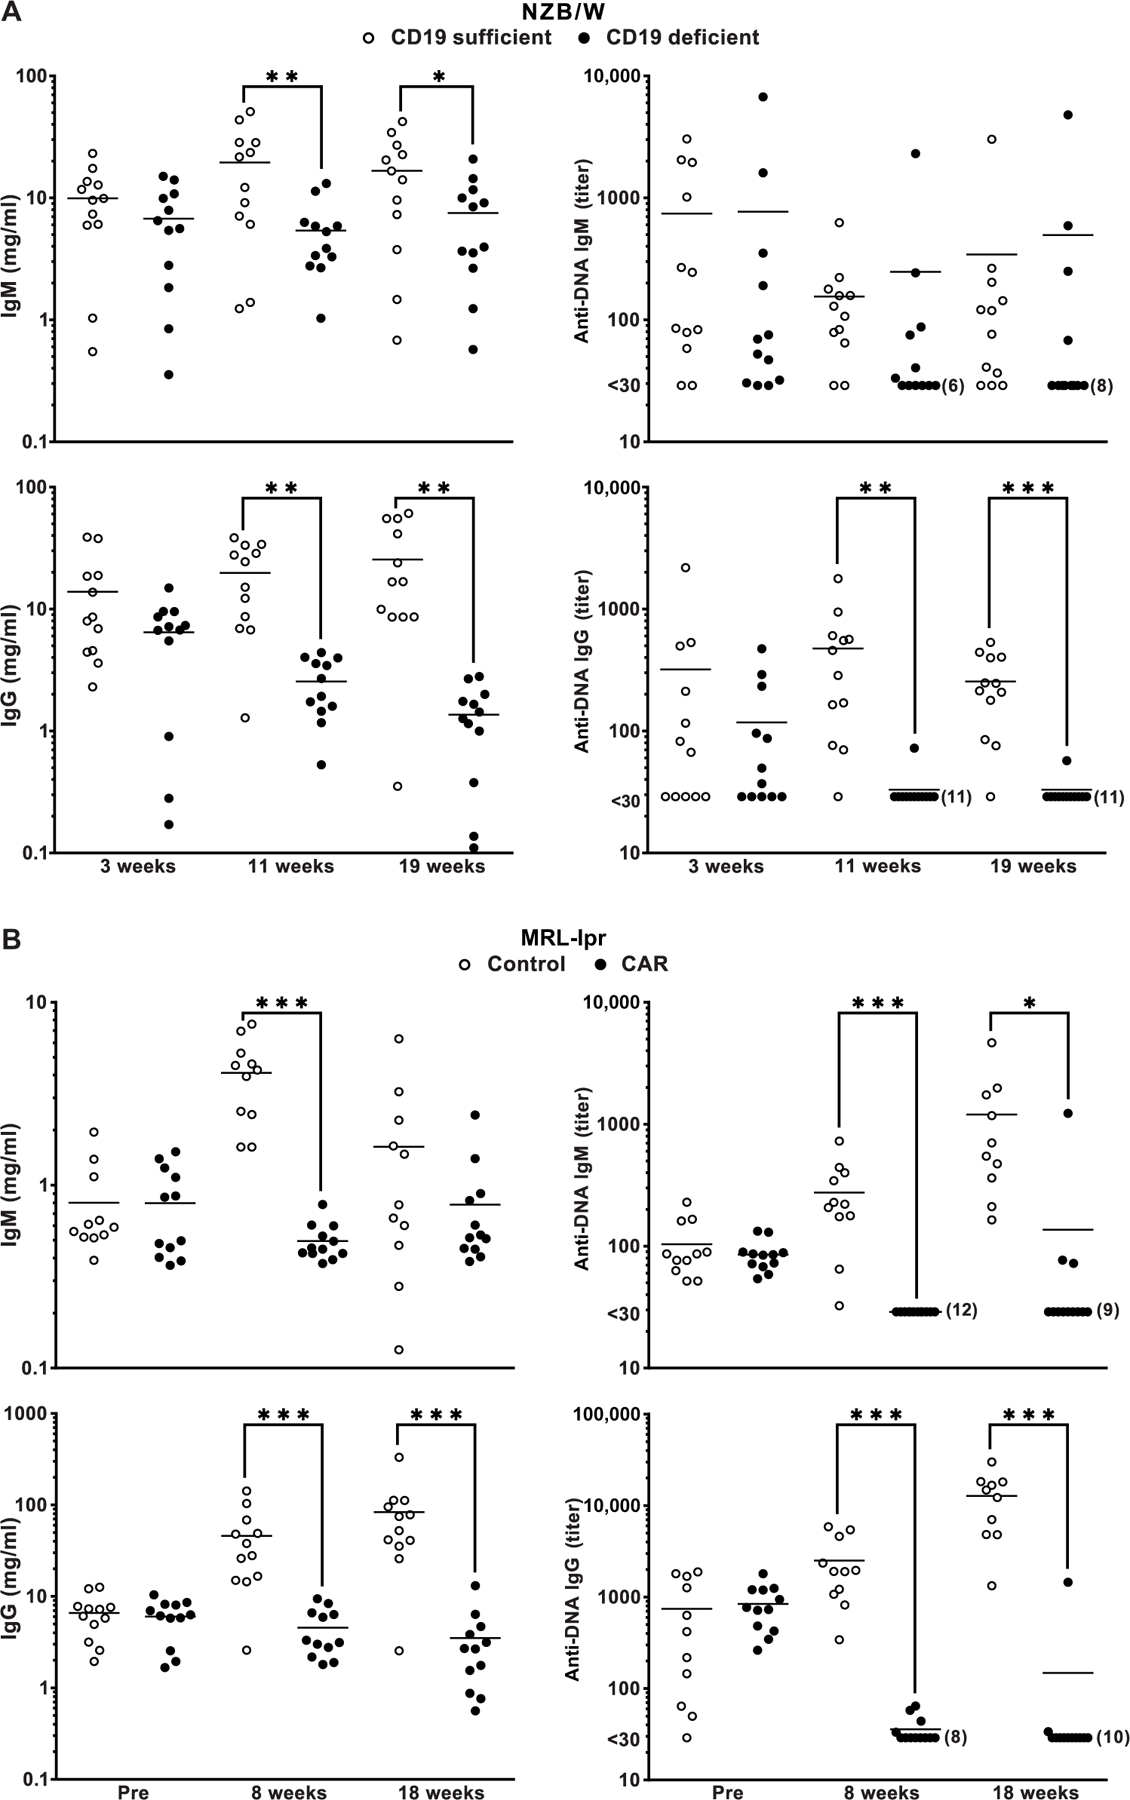
Fig. 3. Serologic analysis of IgM and IgG concentrations and anti-DNA reactivities at different times after CAR T cell infusion.

(A) NZB/W and (B) MRL-lpr plasma were tested using ELISA for total IgM and IgG concentration and IgM and IgG anti-DNA titers. Values for CD19-d and CD19-s and control mice are indicated. IgM and IgG standards were used to generate standard curves for estimating IgM and IgG concentrations. Times of plasma collection for the relevant groups are indicated. Horizontal lines are means. Differences between measurements taken at the indicated time points were compared by one-tailed t test, and significance is indicated by *P < 0.05, **P < 0.01, and ***P < 0.001.
