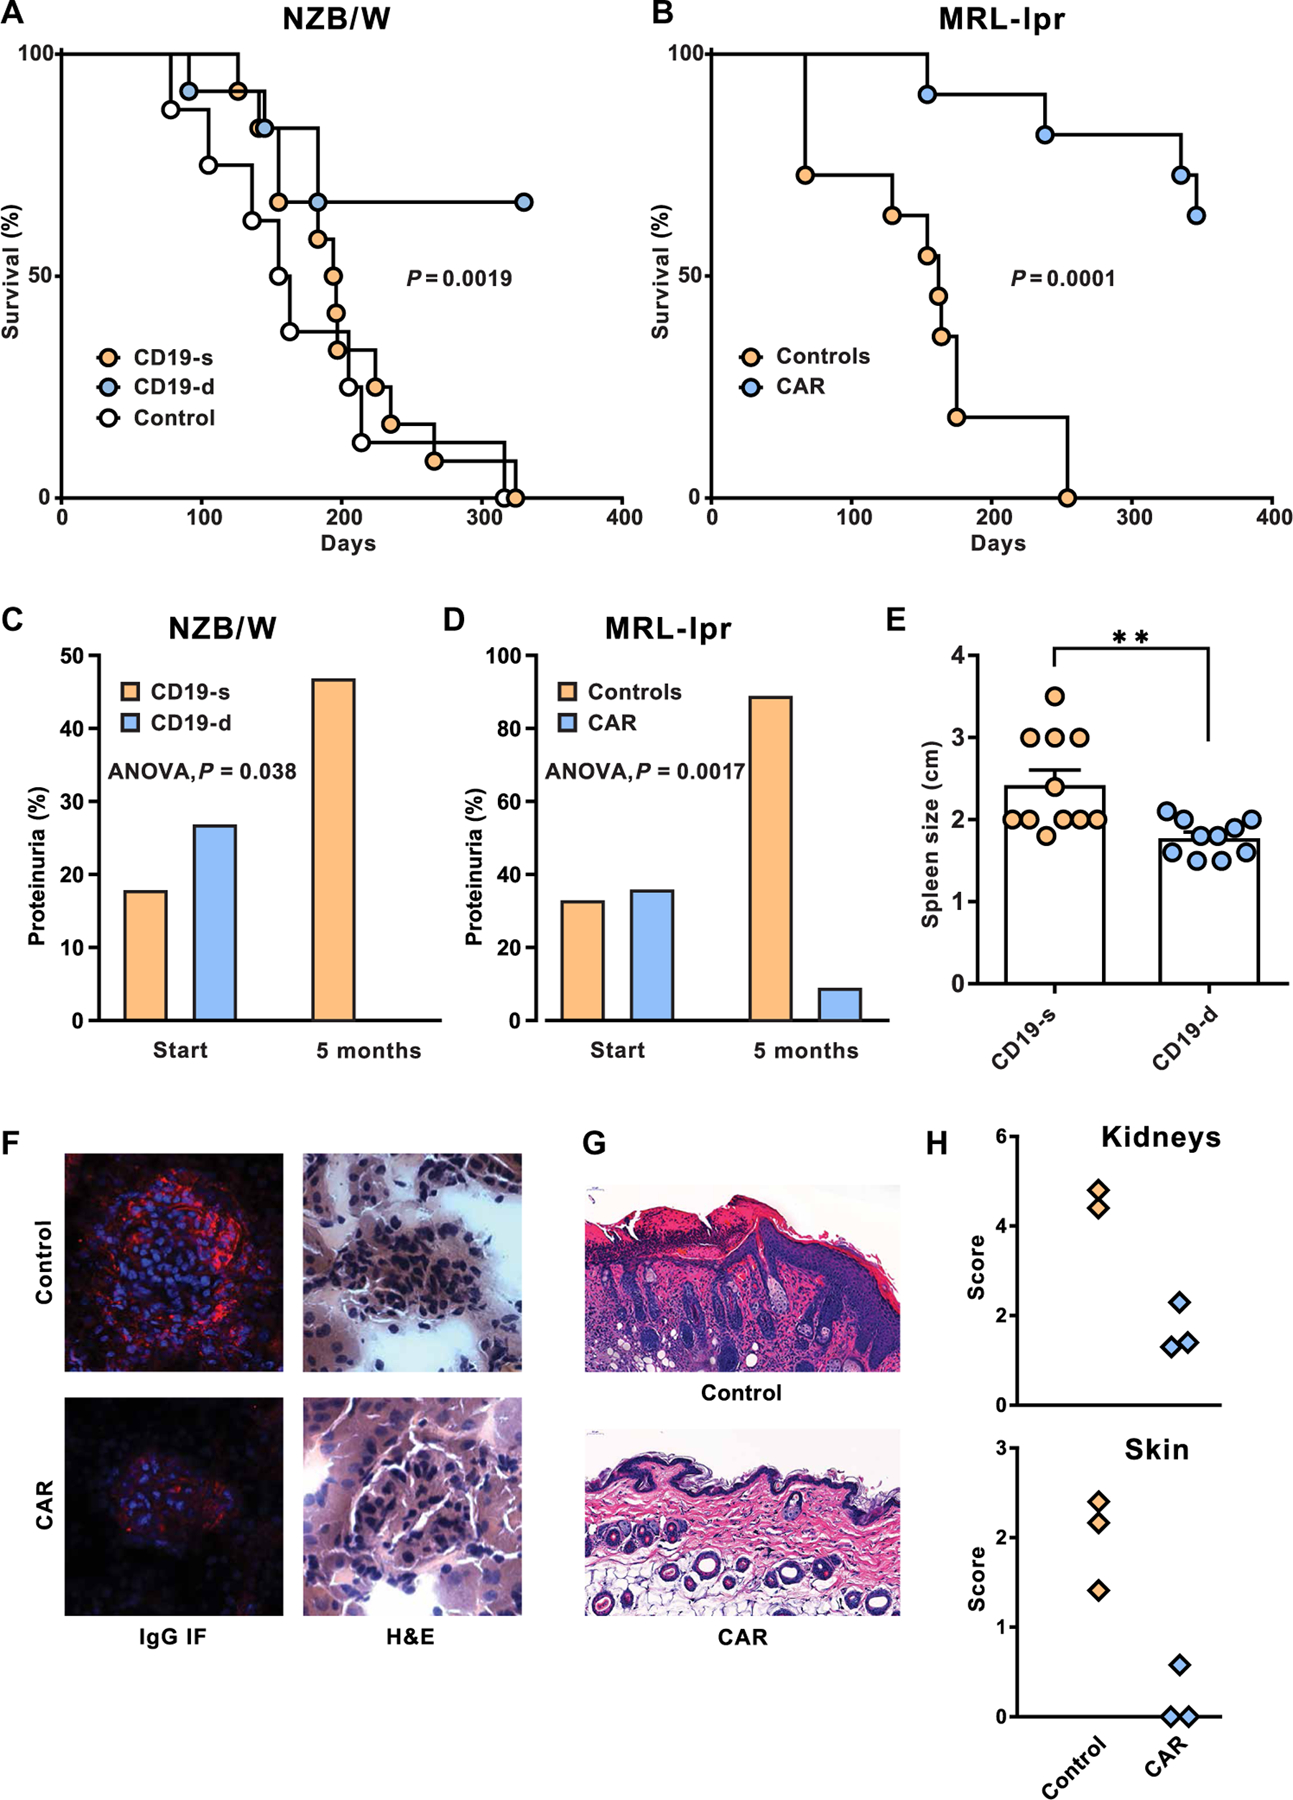
Fig. 4. Impact of CD19-targeted CAR T cell treatment on lupus pathogenesis and survival.

(A) Survival curves of NZB/W mice after CAR T cell infusion into 7-month-old recipients. Survival of CD19-d mice (n = 12) was compared relative to CD19-s mice (n = 12), and significance was determined by log rank (Mantel-Cox; P = 0.0019). For comparison, the survival of control mice (n = 8) is plotted. (B) Survival curves of CAR T cell-treated and control MRL-lpr mice. CAR T cell–treated mice (n = 11) were compared to control MRL-lpr mice (n = 11), and survival of mice in the two groups was evaluated by long rank (Mantel-Cox; P = 0.0001). (C and D) High-grade proteinuria (1 mg/ml and higher) was determined before treatment (start) and at 5 months after CAR T cell treatment. (C) Proteinuria in CD19-s (n = 12) and CD19-d (n = 11) NZB/W mice was analyzed by single-factor analysis of variance (ANOVA) (P = 0.038). (D) High-grade proteinuria in CAR T cell–treated MRL-lpr mice (n = 11) and controls (n = 9) was similarly compared (P = 0.0017). (E) Lengths of spleens in CD19-d and CD19-s NZB/W mice were measured at euthanasia (P < 0.005). Bars are means, and horizontal lines are SEMs. (F) Kidneys from NZB/W mice were sectioned and analyzed for cellularity and morphology by H&E staining and for mouse IgG deposits by immunofluorescence (IF). (G) MRL-lpr skin sections were stained by H&E to compare the epidermis of control and CAR T cell–treated mice. (H) Pathology scores of MRL-lpr kidney and skin sections were determined as described in Materials and Methods.
