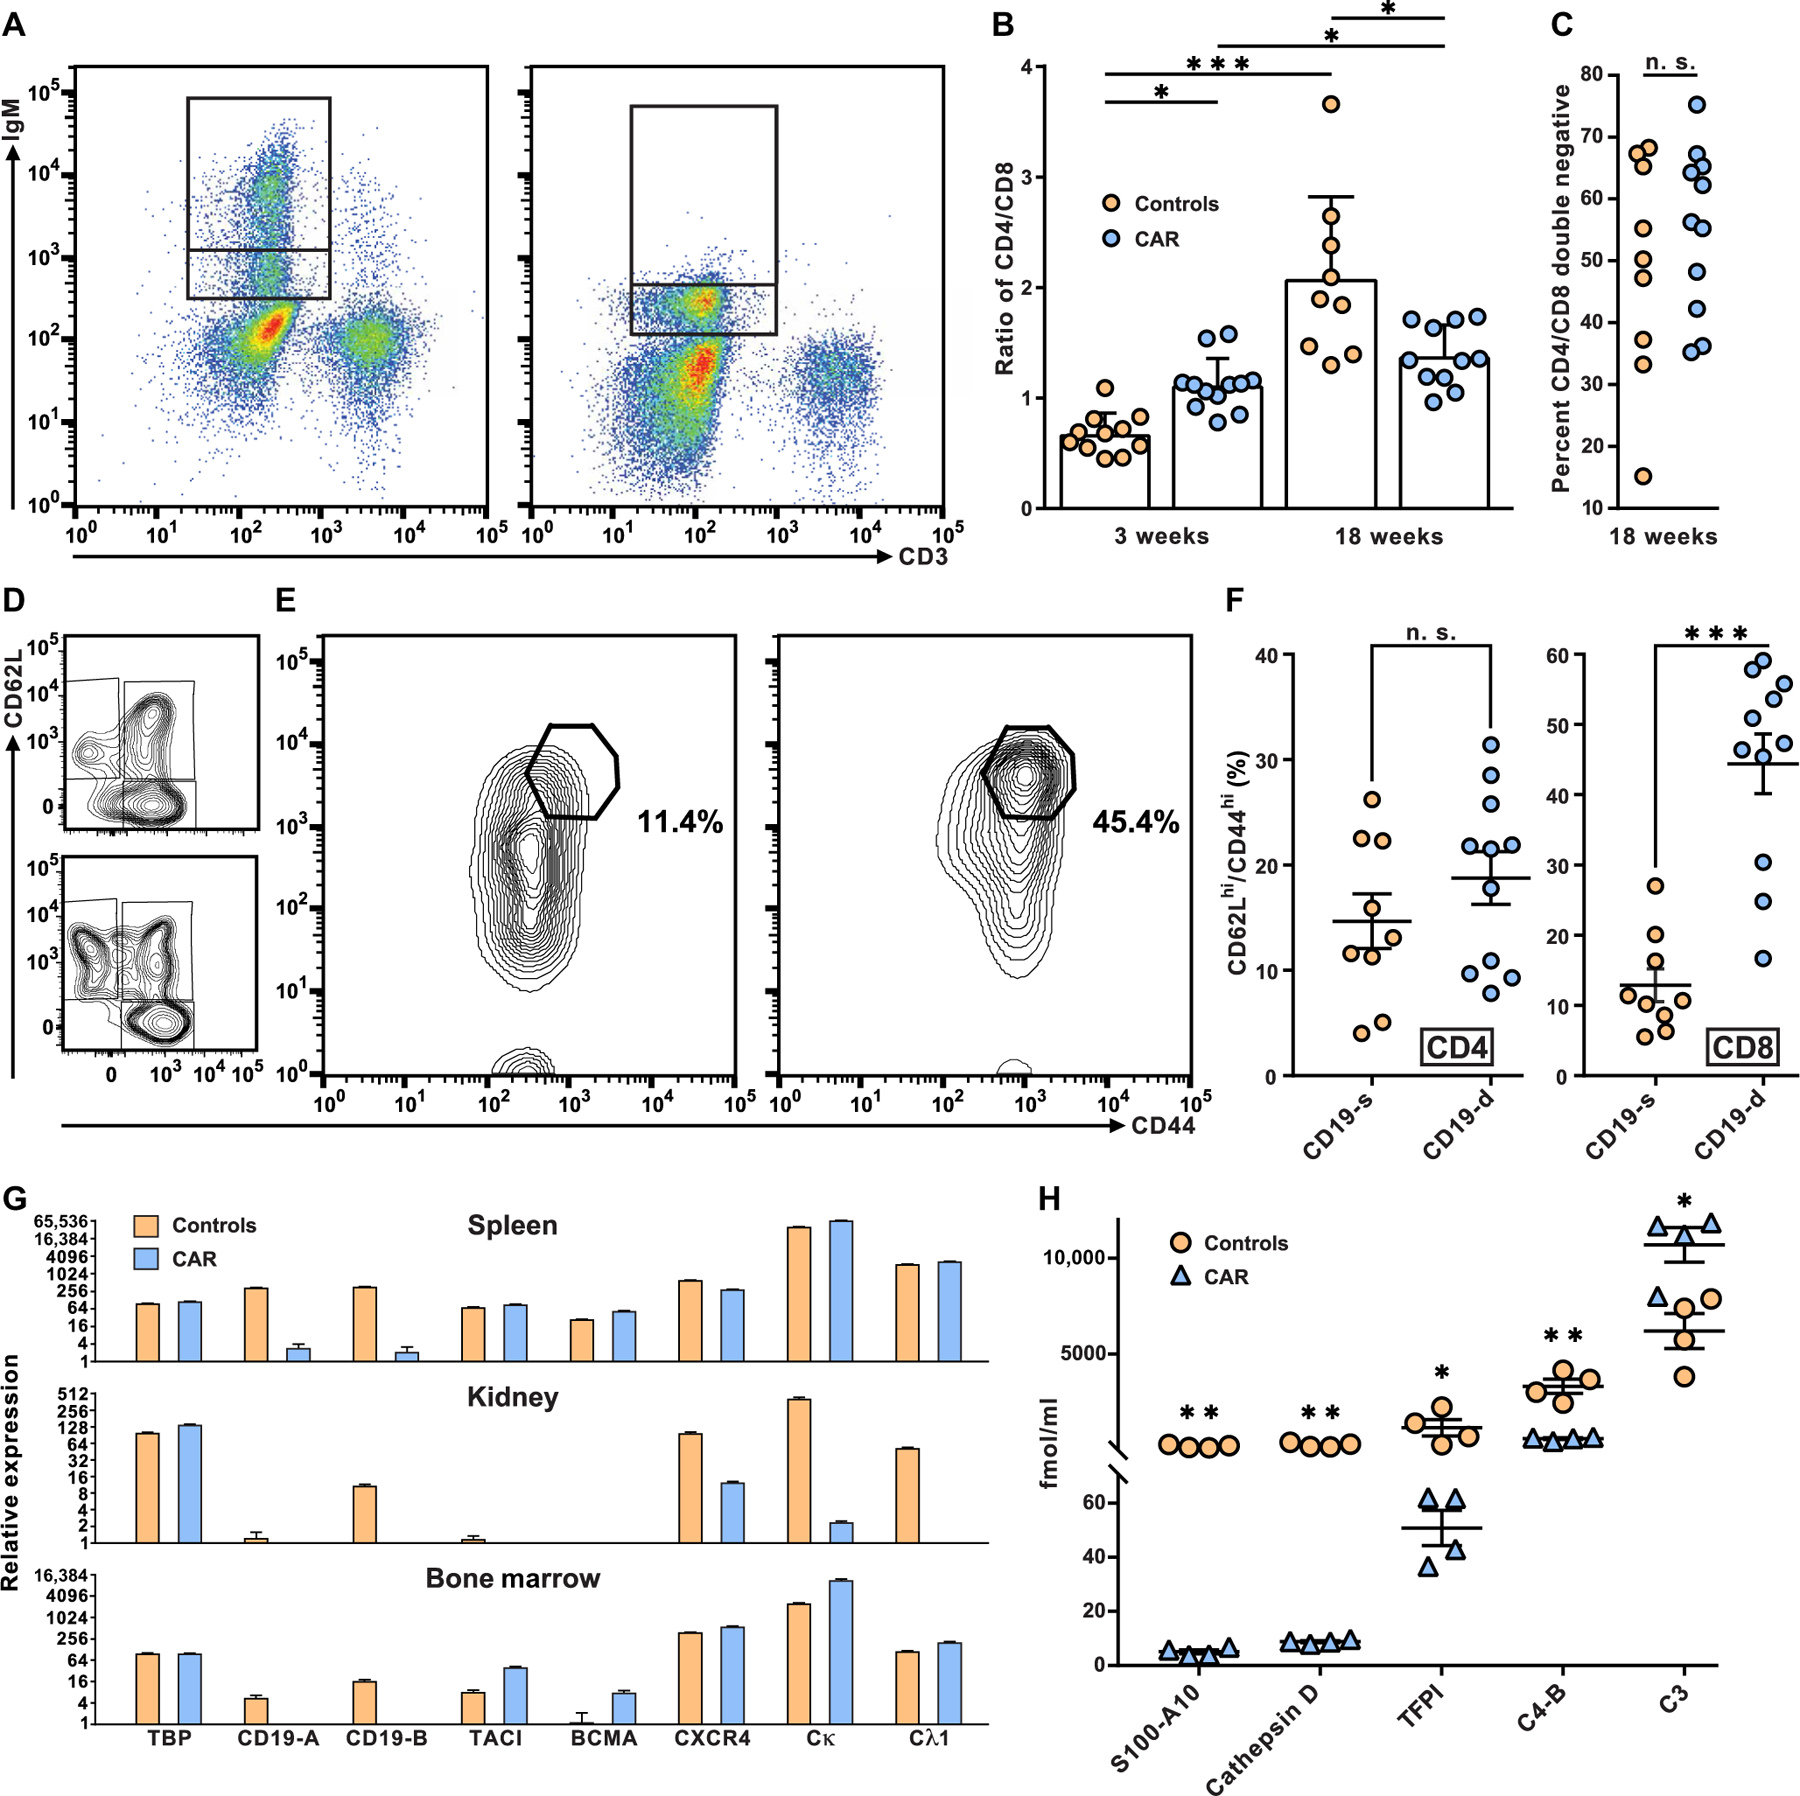
Fig. 5. Effect of CD19-targeted CAR T cell treatment on lymphocyte phenotype and plasma proteome.

(A) The expression of surface IgM on peripheral blood B lymphocytes from control MRL-lpr mice (left) was used to define an intermediate and a high IgM+ population (indicated by stacked gates). These gates were used to assess expression of IgM on B cells from CAR T cell–treated MRL-lpr mice (right). (B) The ratio of CD4 to CD8 T cells was determined in 18-week-old MRL-lpr mice treated with CAR T cells and controls. Each symbol represents data from a single mouse, bars are means, and horizontal lines are SDs. Differences between CAR T cell–treated and control mice were examined by two-tailed t test and noted by *P < 0.05 and ***P < 0.001. (C) Proportions of CD4−CD8− DN T cells as the percentage of CD3+ cells from CAR T cell–treated and control MRL-lpr mice were plotted (n. s., no significant differences). (D) Effector memory (CD62LloCD44hi), central memory (CD62LhiCD44hi), and naïve (CD62LhiCD44lo) CD4+ T cells from representative control (top) and CAR T cell–treated MRL-lpr mice (bottom) were determined (for complete CD4+ T cell phenotype assessment, see table S3). (E) The CD62LhiCD44hi population of CD8+ T cells from a representative control mouse (left) and CAR T cell–treated MRL-lpr mouse (right) are shown, and the percentage of CD8+ T cells in the CD62LhiCD44hi gates was displayed. (F) Overall proportions of CD62LhiCD44hi cells among CD8+ or CD4+ T cells in CAR T cell–treated and control mice were determined and plotted. Each symbol represents data from a single mouse, horizontal lines are means, and offset lines are SDs. Differences between CAR T cell–treated and control mice were examined by two-tailed t test and marked by ***P < 0.001. (G) Relative RNA expression in spleens, kidneys, and bone marrow from four CAR T cell–treated and four control NZB/W mice were measured by RT-PCR for transcripts originating from TBP, a house keeping gene, two regions of CD19, TACI, BCMA, CXCR4, and the light-chain constant regions of Igκ and λ1 (see Materials and Methods and table S2). Values were plotted using ln2. Means and SE are displayed. (H) Plasma was prepared from CAR T cell–treated and control MRL-lpr mice, and plasma proteins were analyzed by mass spectrometry. Horizontal lines are means, and offset lines are SDs. Concentrations were compared by two-tailed t test, and significance was indicated by *P < 0.05, **P < 0.01.
