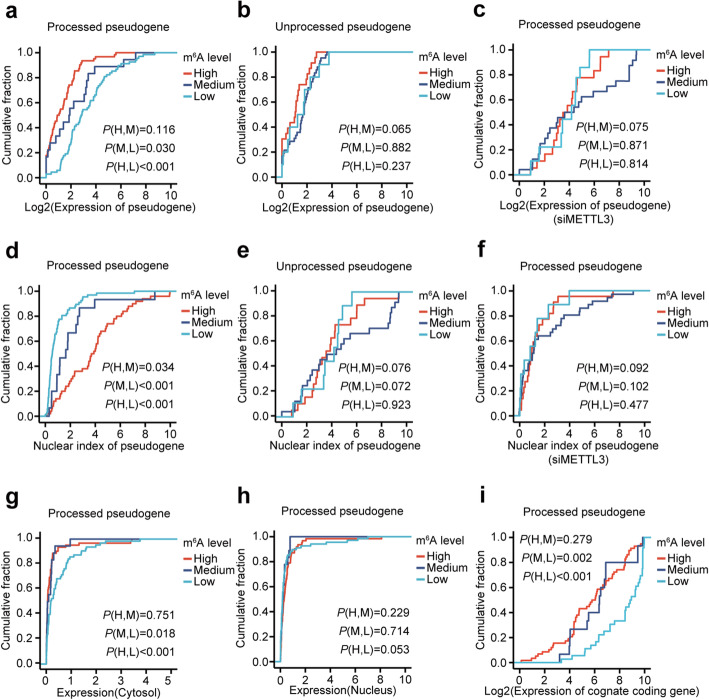
Fig. 3.
m6A facilitates the cytosolic degradation of processed pseudogenes in the GM12878 cell line. a, b Plot of cumulative fraction of expression for processed (a) and unprocessed (b) pseudogene with high (m6A level ≥ 0.6), medium (0.6 > m6A level ≥ 0.3), and low (m6A level < 0.3) m6A levels, respectively. Two-tailed Wilcoxon P values are indicated at the bottom right corner. c Plot of cumulative fraction of expression for processed pseudogenes with high (m6A level ≥ 0.6), medium (0.6 > m6A level ≥ 0.3), and low (m6A level < 0.3) m6A levels respectively in METTL3 knockdown cells. Two-tailed Wilcoxon P values are indicated at the bottom right corner. d, e Plot of cumulative fraction of nuclear indexes (ratio of expression between the nucleus and cytosol) for processed (d) and unprocessed (e) pseudogenes with high, medium, and low m6A levels, respectively. Two-tailed Wilcoxon P values are indicated at the bottom right corner. f Plot of cumulative fraction of nuclear indexes for processed pseudogenes with high, medium, and low m6A levels respectively in METTL3 knockdown cells. Two-tailed Wilcoxon P values are indicated at the bottom right corner. g, h Plot of cumulative fraction of cytosolic (g) and nuclear (h) gene expression for processed pseudogene with high, medium, and low m6A levels respectively. Two-tailed Wilcoxon P values are indicated at the bottom right corner. i Plot of cumulative fraction of expression of cognate protein-coding genes for processed pseudogene with high, medium, and low m6A levels respectively. Two-tailed Wilcoxon P values are indicated at the top left corner and bottom right corner, respectively

