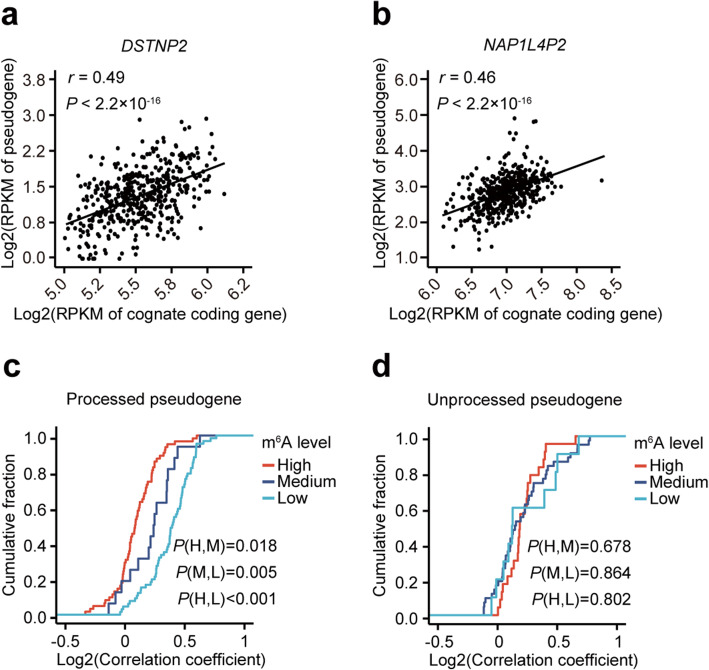
Fig. 4.
m6A of processed pseudogenes disrupt their crosstalk with their cognate protein-coding genes. a, b Scatter plots showing the correlation of the expressions of two representative processed pseudogenes DSTNP2 (a) and NAP1L4P2 (b) with their cognate protein-coding genes among 462 B-lymphoblastoid cell lines. P values of Pearson correlations are indicated at the top left corners. c, d Plot of cumulative fraction of correlation coefficients of gene expressions for processed (c) and unprocessed (d) pseudogenes with their cognate protein-coding genes among 462 B-lymphoblastoid cell lines. Pseudogenes with high, medium, and low m6A levels are shown separately. Two-tailed Wilcoxon P values are indicated at the bottom right corners

