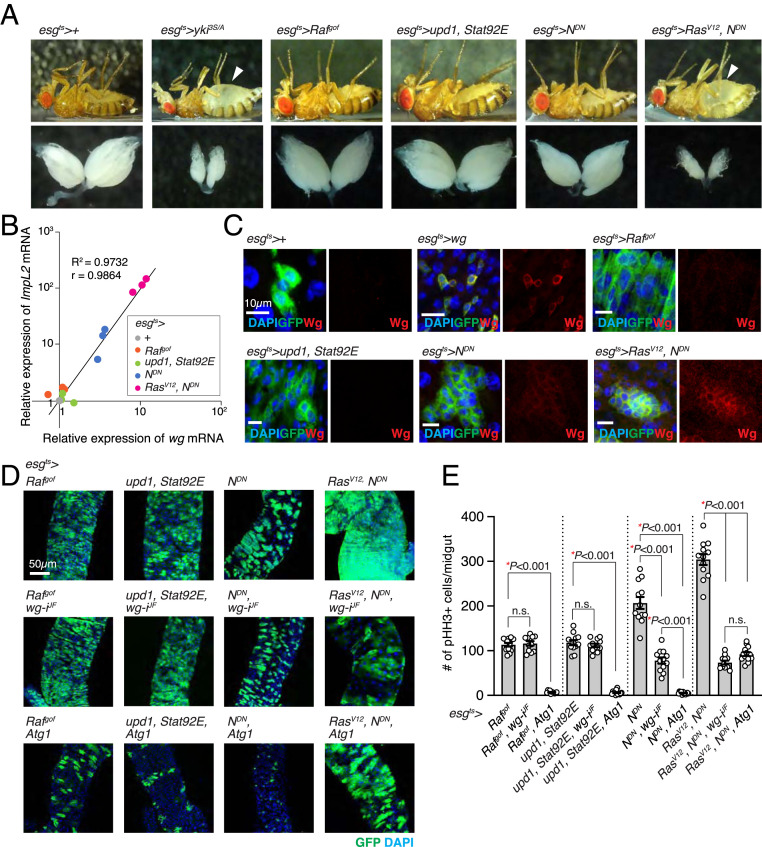
Fig. 3.
Wg is specifically required for the growth of midgut tumors with elevated ImpL2 expression. (A) Representative images of fly and ovary. The arrowheads indicate abdominal bloating. esgts>RasV12, NDN flies were incubated at 29 °C for 4 d, and control (esgts>+) and other flies were incubated for 6 d to induce transgene expression. (B) Correlative plot of relative ImpL2 and wg mRNA levels. mRNA expression values of wg and ImpL2 in the midguts with indicated genotypes were measured by qRT-PCR and then normalized to those values in the control midguts (esgts>+). The relative wg and ImpL2 mRNA levels from three independent experiments are shown in the x-axis and y-axis, respectively. The coefficient of determination (R2) is 0.9732, and the Pearson correlation coefficient (r) is 0.9864 (P < 0.0001). (C) Wg immunostaining in the midguts. (Scale bars, 10 µm.) (D) Images of posterior midguts. (Scale bar, 50 µm.) (E) Quantification of pHH3+ cells per midgut. Mean ± SEMs are shown with individual data points. *P < 0.01, two-tailed unpaired Student’s t test between two groups indicated with bracket. All transgenes were induced with esgts for 6 d except for “RasV12, NDN,” “RasV12, NDN, wg-iJF,” and “RasV12, NDN, Atg1,” which were induced for 4 d. See also SI Appendix, Figs. S5 and S6.

