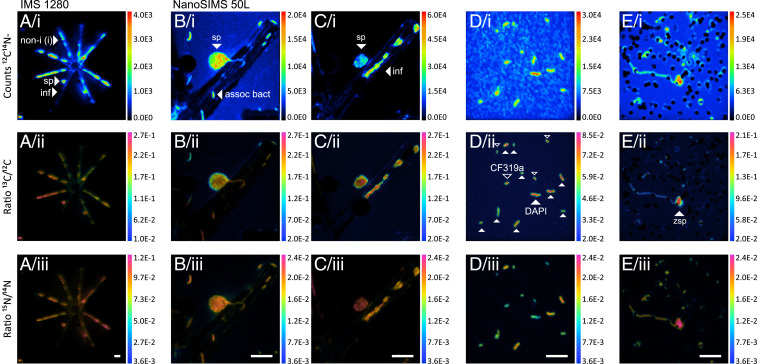
Fig. 3.
SIMS images. (A) Asterionella colony with a fungal sporangium analyzed on the IMS 1280 (90 × 90 µm raster). (B–D) Single Asterionella cell, Asterionella-associated and free-living bacteria, and (E) zoospores analyzed on the NanoSIMS (25 × 25 µm raster). B and C display the same field of view, first, imaged after 90-s presputtering to analyze diatom-associated bacteria (B) and second, after 20-min presputtering to analyze Asterionella and its associated sporangium (C). Free-living bacteria in D correspond to the ones shown in Fig. 1F. The filled arrows mark DAPI-stained cells, and the no-filled arrows mark CF319a-hybridized cells (Bacteroidetes). The abbreviations are defined in Fig. 1G. (White scale bars, 5 µm [Bottom].)

