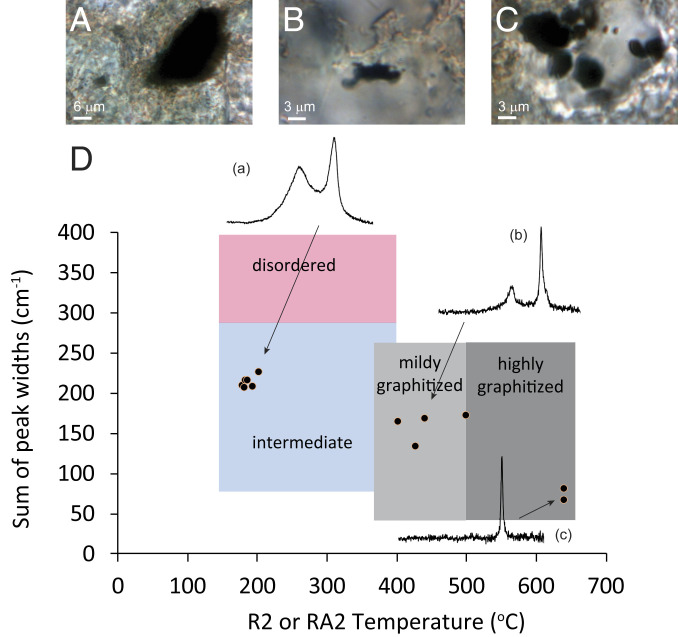
Fig. 1.
Raman data for the initial analysis of sample XML 319.6. (A–C) Photomicrographs of selected graphite grains found in the sample. (D) "Sparkes" plot of calculated maturation temperature vs. sum of peak widths, with examples of Raman spectra. Regions of different thermal maturity are also shown after Sparkes et al. (29).

