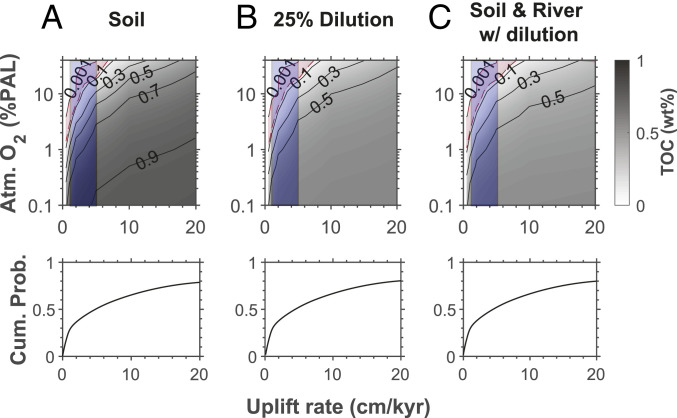
Fig. 3.
Results from our soil carbon oxidation model showing the concentrations of organic carbon for different concentrations of atmospheric oxygen and different rates of uplift. (A) Concentrations of organic carbon in the surface soils. (B) Concentrations of petrographic carbon exported to marine sediments assuming dilution by clastic particles from nonsedimentary rocks. (C) Concentrations of petrographic carbon exported to marine sediments including oxidation during river transport. The blue field shows the likely range of uplift for the terrains supplying particles to the sedimentary rocks of our study. (Bottom) The cumulative probability of uplift rate for modern river basins. See text for details.

