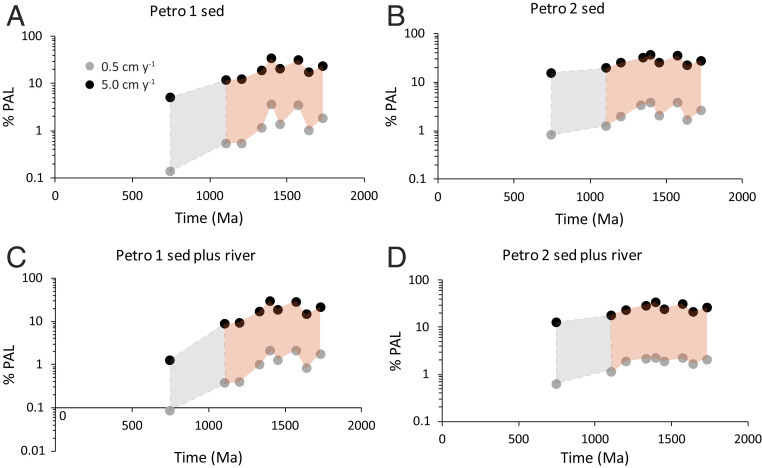
Fig. 4.
Minimum oxygen estimates as a function of time based on our carbon oxidation model both without (A and B) and with (C and D) oxidation during river transport and for high (Petro 1, A and C) and low (Petro 2, B and D) estimates for maximum concentrations of petrographic carbon. The colored field shows the range of minimum oxygen estimates constrained by uplift rates of 0.5 cm ⋅ y−1 and 5 cm ⋅ y−1. The grey colored field between 742 and 1,100 Ma shows the lower oxygen estimates based on the high petrographic carbon estimates for sample AK10-53–15. We found no recycled petrographic carbon in this sample, and the high resulting petrographic carbon estimates (yielding lower estimates for atmospheric oxygen concentration) are based on the high TOC concentration of the sample. See text for details.

