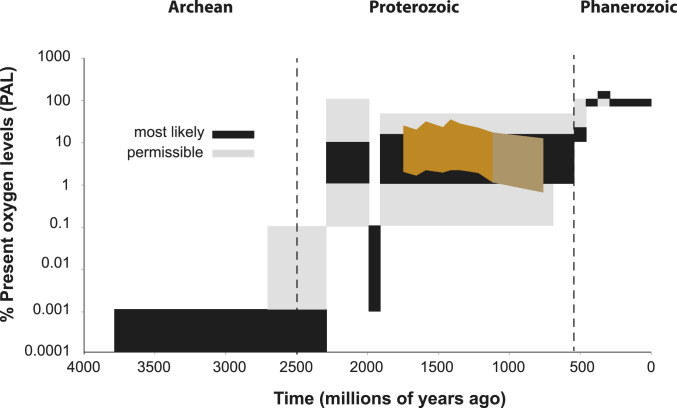
Fig. 5.
Results from the Petro 2 sed plus river analysis of minimum oxygen levels plotted on the long-term trend in atmospheric oxygen evolution that is replotted from ref. 71, including the regions of oxygen levels deemed as "most likely" and "permissible" with available evidence. The separate colored field between 742 and 1,100 Ma designates the lower oxygen estimates based on the high petrographic carbon estimates for sample AK10-53–15.

