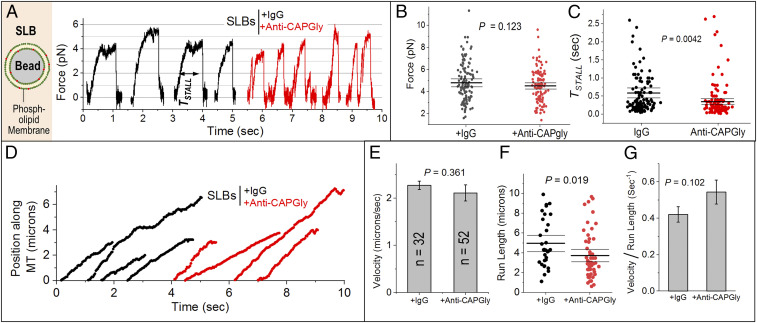
Fig. 4.
Validation of the effects of anti-CAPGly on supported lipid bilayers. (A) Image on Left is a schematic of a single supported lipid bilayer (SLB). Bead is 500 nm in diameter. Lipid membrane consists of phosphatidyl choline (PC) and phosphatidic acid (PA). SLBs were incubated with ATP releasate from Dictyostelium and then treated with 0.5 µM IgG or anti-CAPGly. Representative stalls are shown. (B) FSTALL is statistically the same for IgG- and anti-CAPGly-treated SLBs. Mean, thick black line. The 95% confidence interval of means (thin black lines) was calculated using a bootstrap algorithm. Comparison of IgG against anti-CAPGly: bootstrap P = 0.123; KS test P = 0.225, D = 0.125; Mann–Whitney U test = 8,803, probability > U = 0.30. Phagosomes used: +IgG = 128; +anti-CAPGly = 128. (C) TSTALL for SLBs treated with IgG and anti-CAPGly. Mean, thick black line. The 95% confidence interval of means (thin black lines) was calculated using a bootstrap algorithm. Comparison of IgG against anti-CAPGly: bootstrap P = 0.0042; KS test P < 0.0001, D = 0.273; Mann–Whitney U test = 10,801, probability > U is less than 0.0001. (D) Representative position-time plots of individual SLBs treated with 0.5 µM IgG or anti-CAPGly. All runs ended in detachment of SLB from the MT. (E) Velocity of SLBs treated with IgG or anti-CAPGly. Error bars, SEM. P value was obtained using Student’s t test. n = number of SLBs used. (F) SLB run lengths after IgG and anti-CAPGly treatment. Mean, thick black line. The 95% confidence interval of means (thin black lines) was calculated using a bootstrap algorithm. Comparison of IgG against anti-CAPGly: bootstrap P = 0.019; KS test P = 0.016, D = 0.339; Mann–Whitney U test = 1,114, probability > U = 0.01. (G) (velocity)/(run length), interpreted as KOFF for SLBs treated with IgG or anti-CAPGly. There is no significant change across the samples. Student’s t test was used to obtain P values.

