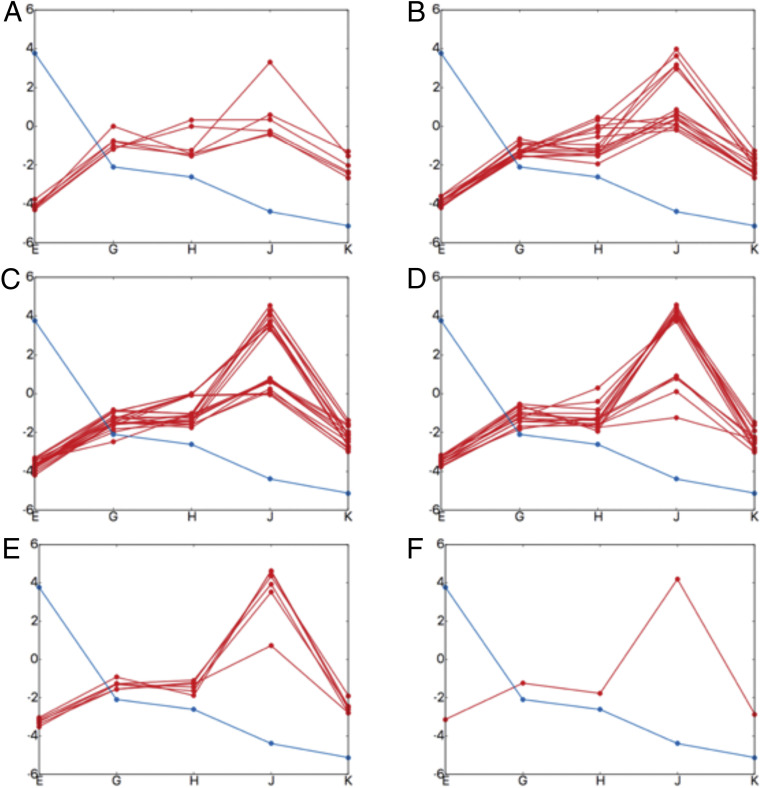
Fig. 8.
The effect of mutations on the directional translocation. Each box shows one-dimensional substrate (PDLD/S-LRA/) binding profiles. The x axis denotes the structures (structure EB [“E”], EC1 [“G”], EC2 [“H”], ED1 [“J”], and ED2 [“K”]) and the y axis denotes energy in kilocalories per mole. The blue line shows the wild type and the red line shows the mutated profiles (aromatic-prior lysine residues were mutated to alanine). (A) Each red line (six possibilities) shows a single mutation at different positions along pore loop 1. (B) Each red line (15 possibilities) shows a combination of two mutations at different positions along pore loop 1. (C) Each red line (20 possibilities) shows a combination of three mutations at different positions along pore loop 1. (D) Each red line (15 possibilities) shows a combination of four mutations at different positions along pore loop 1. (E) Each red line (six possibilities) shows a combination of five mutations at different positions along pore loop 1. (F) The red line (one possibility) shows all the six lysine residues mutated to alanine along pore loop 1.

