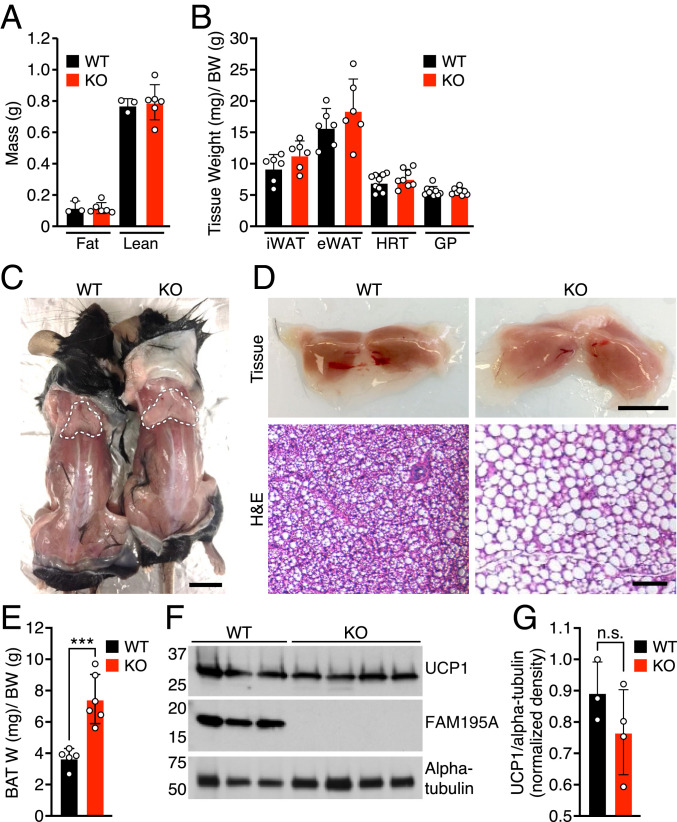
Fig. 2.
FAM195A loss of function causes whitening of BAT tissues. (A) Body composition of mice measured by NMR (n = 3 WT; n = 6 KO). (B) Tissue weight of WT and FAM195A KO mice. Data are expressed as tissue weight normalized over body weight. iWAT and eWAT, n = 6 adult mice for each genotype; HRT and GP, n = 9 for WT and n = 8 for KO adult mice. (C) Representative photograph showing BAT of WT and FAM195A KO mice. The dotted white lines outline BAT tissues. (Scale bar: 1 cm.) (D) Morphology (Upper) and H&E staining (Lower) of WT and FAM195A KO BAT. (Scale bars: Upper, 500 mm; Lower, 50 μm.) (E) WT and FAM195A KO BAT weight. Data are expressed as BAT weight normalized to BW. n = 5 WT and n = 6 KO. ***P < 0.001. (F) Western blot analysis showing UCP1 and FAM195A protein expression in BAT from WT and FAM195A KO mice; alpha-tubulin was used as a loading control. (G) Quantification of western blot in F. Data are shown as mean ± SD; unpaired t test (E). W, weight; BW, body weight; iWAT, inguinal white adipose; eWAT, epididymal white adipose; HRT, heart; GP, gastrocnemius, plantaris; H&E, hematoxylin and eosin; n.s., not significant.

