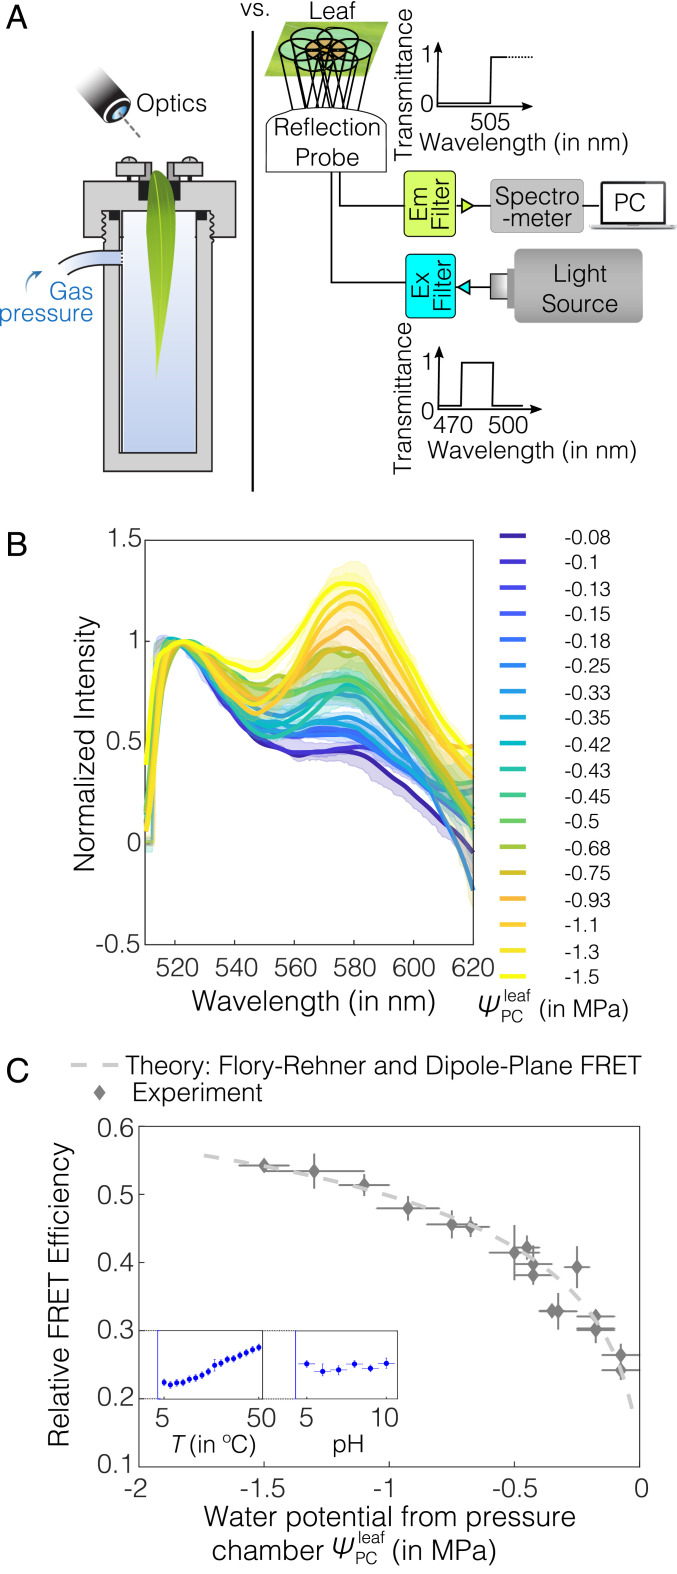
Fig. 3.
AquaDust response to leaf water potential. (A) Schematic diagrams shows calibration against Scholander pressure chamber (Left) and instrumentation for a typical in situ measurement (Right): A mercury lamp was used as source for illumination, and a narrow-band-wavelength optical filter was used to select the excitation-light wavelength (here, it is 470 to 500 nm) used to excite AquaDust using a reflection probe. The reflected light was captured by the central fiber and sent to the spectrometer after filtering out the reflected excitation wavelengths using an emission filter to avoid the saturation of detector; spectrometer output was recorded and saved. (B) Spectra of AquaDust in maize leaves at different water potentials as measured with a pressure chamber, , on the tip of actively transpiring maize leaves. Bold lines represent spectra closest to the mean FRET efficiency, and the translucent band represents the error in the spectra, as obtained from three to six measurements. The legend provides mean values of corresponding to each spectrum. (C) Relative FRET efficiency as calculated from the spectra in B is plotted against . A theoretical prediction as obtained from the Flory–Rehner theory and dipole-plane FRET model is plotted against water potential. (See SI Appendix, Table S3 for the numerical values of the plotted data.) The vertical error bars represent the range of relative FRET efficiency from AquaDust, and the horizontal error bars represent the range of water potential from pressure chamber. C, Inset shows the response in terms of the relative FRET efficiency of AquaDust suspension (y axis ranges from 0.2 to 0.3) to temperature ranging from 5 to C and pH of the buffer ranging from 5 to 10 (see SI Appendix, section S4 M and N for details).

