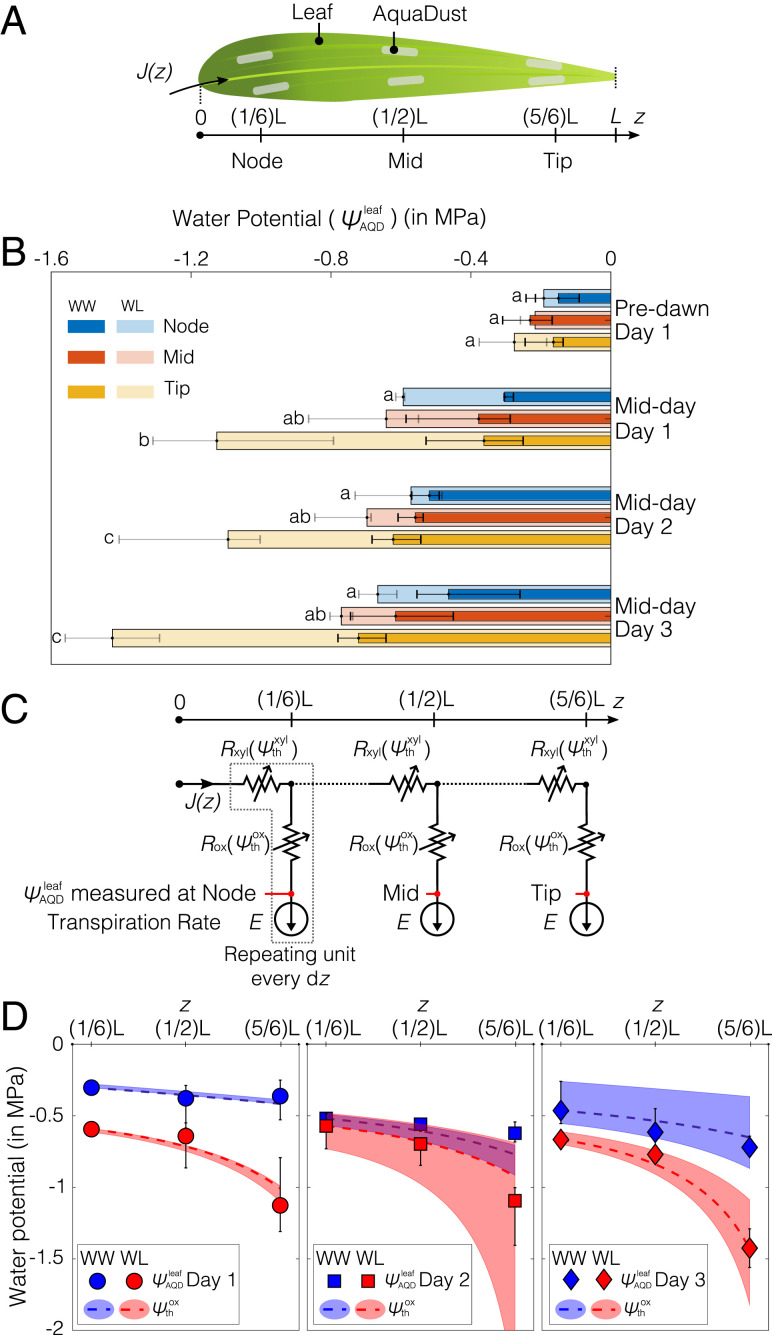
Fig. 4.
Measurements of water potential gradients along a leaf. (A) Illustration of a maize leaf with AquaDust infiltrated at the node (first one-third of leaf blade connected to stem), mid (next one-third of leaf blade), and tip (final one-third of leaf blade). (B) Water potential measured using AquaDust () at node, mid, and tip of the leaf on maize plants in WW condition at predawn ( h) and midday ( h) for 3 d (days 1, 2, and 3); and for plants left unwatered (WL) for 1 d (day 1) at predawn ( h) and midday ( h); plants left unwatered for 2 d at midday (day 2); and plants left unwatered for 3 d at midday (day 3). Bar length and error bars represent the median and the full range, respectively, of water potential obtained using three measurements per AquaDust infiltration zone on three different plants. The a,b, ab, and c letters on the left side of each bar denote the Tukey’s honestly significant difference test result of among leaf positions under the WL condition. Under WW treatment, were not significantly different among tip, mid, and node of the leaf (see SI Appendix, section S5A and Tables S5 and S6 for details). (C) Diagram of a hypothetical hydraulic circuit model of leaf with three segments (node, mid, and tip) that correspond to the sites of measurements in B. In each segment, the resistances both in the xylem () and outside the xylem () depend on the local xylem and outside-xylem water potential ( and ). Transpiration rate () is constant and leads to a position-dependent flux in the xylem, . The measurements of water potential with AquaDust are assumed to correspond to in each segment. (D) Predictions of (dashed curves) with the model in C are compared against the water potential measured by using AquaDust () from WW and WL plants (from B) on 3 d with (range); the color-coded shaded regions represent the range of values based on the range of imposed rates of transpiration. (See SI Appendix, section S5C for details of the model.)

