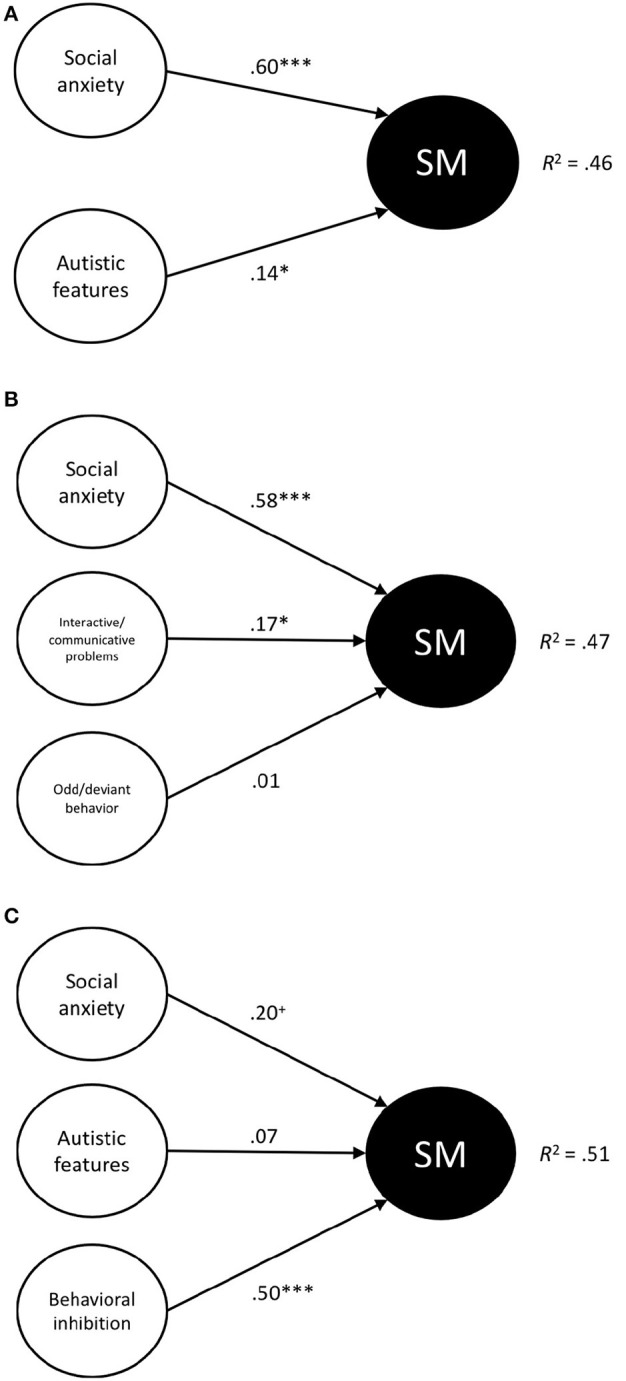
Figure 1.

(A–C) Schematic representation of the three regression models that were tested. Standardized betas and R2 values are shown. SM, Symptoms of Selective Mutism. +p < 0.10, *p < 0.05, ***p < 0.001.

(A–C) Schematic representation of the three regression models that were tested. Standardized betas and R2 values are shown. SM, Symptoms of Selective Mutism. +p < 0.10, *p < 0.05, ***p < 0.001.