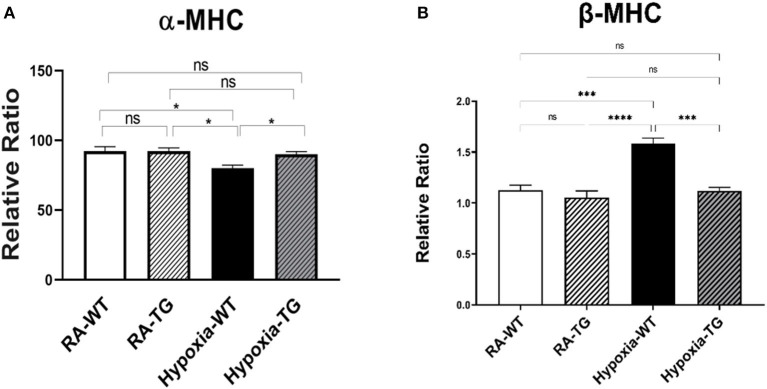
Figure 7.
(A,B) RT-PCR for α and β myosin heavy chain. Adult mice (C57B6) (WT) and EC-SOD transgenic mice (TG), were exposed to 10% hypoxia for 21 days (WT). Room air animals were used as control group (RA). Quantitative RT-PCR was used to assess gene expression analysis of α-MHC in the right ventricular tissue. All experiments n = 5. Data represents mean ± SEM. *P < 0.05, **P < 0.01, ***P < 0.001, ****P < 0.0001.

