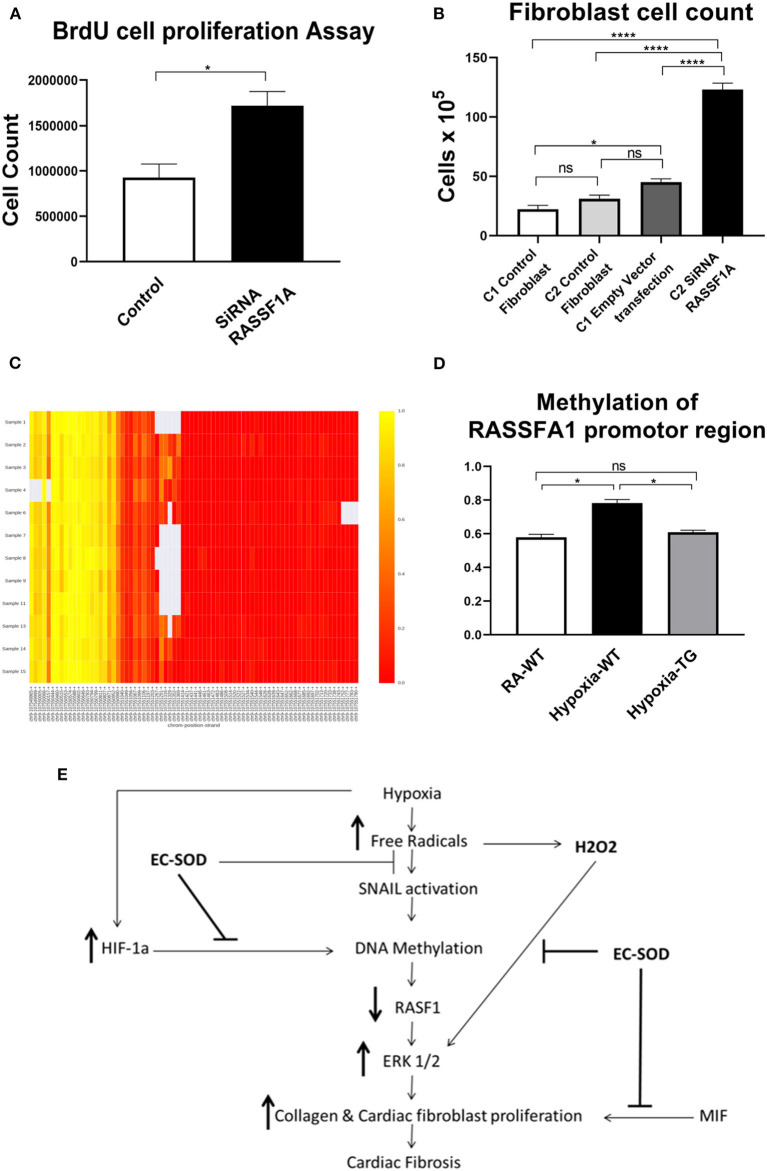
Figure 8.
Cell proliferation studies after transfection with SiRNA for RASSF1A—Cardiac fibroblasts were transfected with SiRNA for RASSF1A and compared to cells placed in RA which served as a control. BrdU cell proliferation studies were undertaken (A), and cells as having underwent cell counts (B). DNA methylation studies of the RASSF1A promotor region as shown in the heat map: RA group (samples 1–4); WT hypoxic group (Samples 6–9); TG hypoxic group (samples 11–15) (C). Quantitative estimation of methylation level among the three studied groups (D). Proposed mechanism (E). Data represent mean ± SEM. *P < 0.05, **P < 0.01, ***P < 0.001, ****P < 0.0001.

