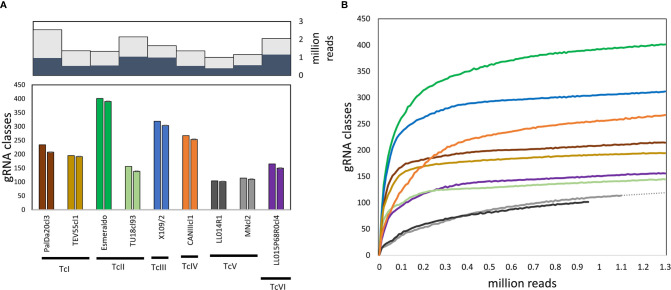
Figure 1.
Variable gRNA diversity among strains. (A) Top, mHVR sequences with gRNA hits (dark grey) related to the number of analyzed mHVR sequences (light gray); bottom, number of gRNA classes (>20 reads) using a SWARM-like algorithm and detected for each strain (left column for each strain) and the average number of gRNA classes after down-sampling one-hundred times the number of paired-end reads to 950,000 (right column for each strain) with standard deviation bars. (B) Rarefaction curves for the number of gRNA classes (>20 reads) for each strain (solid lines, the color reference is according to (A). Dotted line is an extrapolation for MNcl2 based on a linear regression using last ten samples showing that increasing the sequencing depth will not significantly increase the number of detected gRNA classes.

