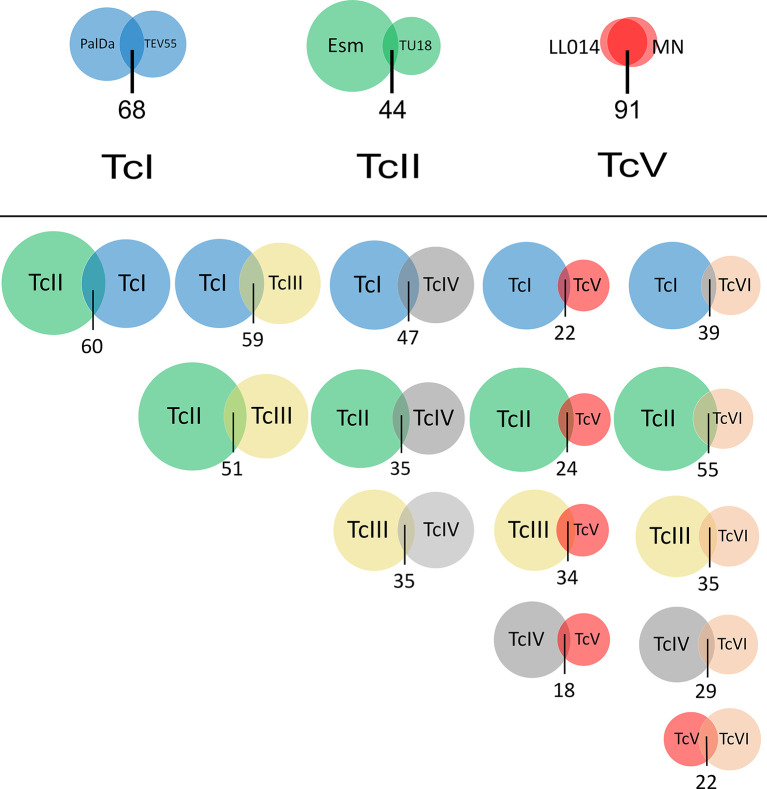
Figure 2.
Venn diagrams showing overlapping gRNA repertoires between strains of the same DTU and between DTUs. Circle size represents the number of gRNA classes identified in a strain (above) or in a DTU (below). The overlapping area among circles indicates gRNA classes with more than 20 reads that are shared between strains or DTUs. The number below circles represents the percentage of shared gRNA classes. PalDa=PalDa20cl3, TEV=TEV55cl1, Esm=Esmeraldo, X109=X109/2, Tu18=Tu18cl93, MN=MNcl2 and LL014=LL014R1.

