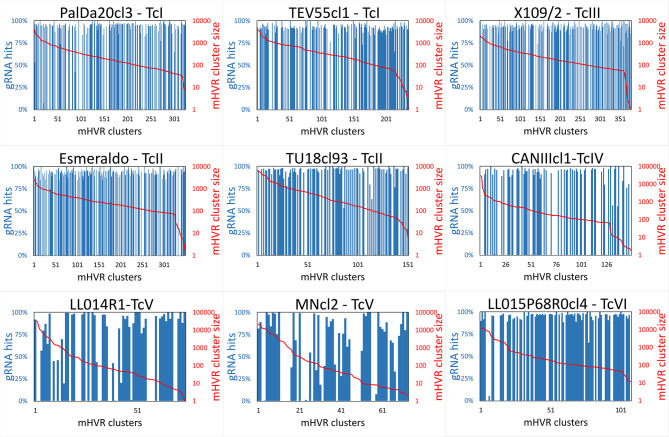
Figure 3.
The number of mHVR sequences in a cluster is not related to the coding of gRNAs. mHVR clusters were graphed in decreasing order according to their size (mHVR cluster size is indicated with a solid redline). Each blue bar indicates the percentage of reads in the mHVR cluster in which a gRNA was identified (gRNA hits). Red color indicates percentage of reads in the mHVR cluster where gRNAs were not detected.

