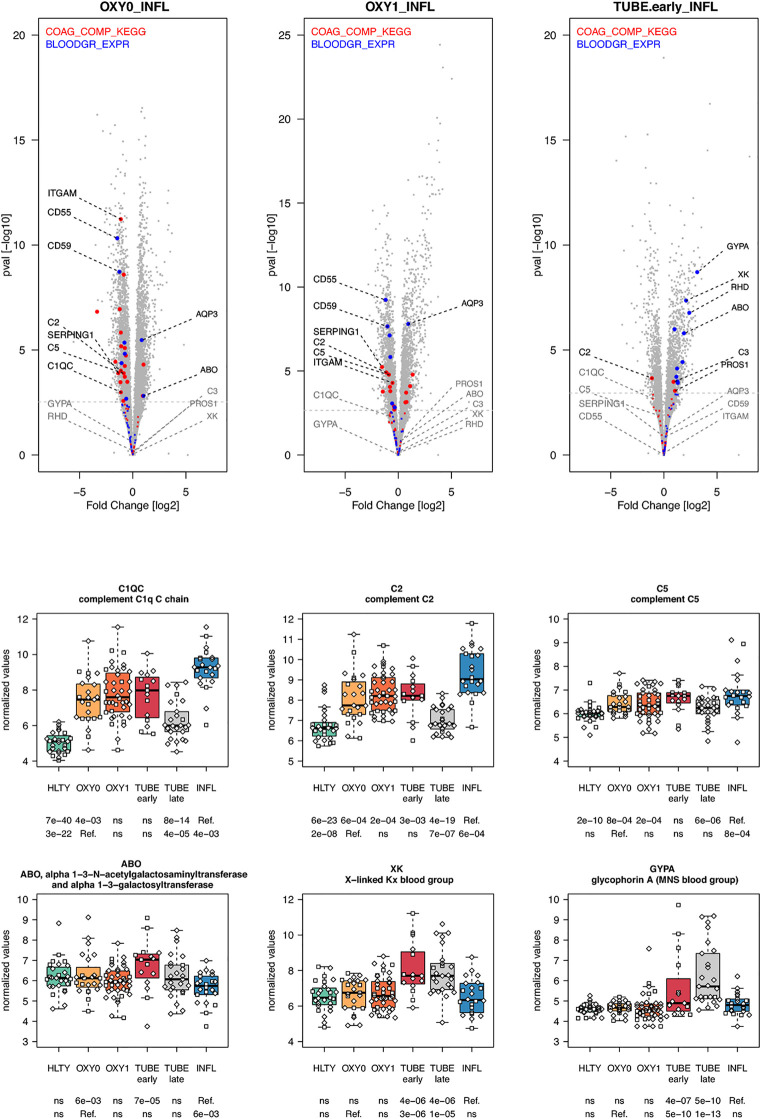
Figure 10.
Differentially expressed genes (DEGs) involved in complement system and blood group. Upper panel: for each comparison indicated in the volcano plot header, the distribution of log2 fold changes and P-values of all detected genes is shown as gray dots. Red and blue dots indicate genes involved in complement system and blood group respectively. Genes’ sets are selected from different GO, REACTOME and/or KEGG pathways (see Supplementary Table 2 ). The dotted horizontal gray line indicates the limit under which –log10(P-value) becomes non significant once adjusted for multiple testing (adjusted P > 0.01). Lower panel shows detailed expression levels of selected genes involved in complement system and blood groups in the different groups of patients. Groups used for comparisons include SARS-Cov-2 infected patients (no oxygen support [OXY0], oxygen support [OXY1], intubation with sampling within 7 days [TUBE early] or >7 days [TUBE late] after hospital admission), Influenza virus [INFL] infected patients and non-infected controls [HLTY]. Adjusted P-values of pairwise comparisons between a reference group (Ref.) and another group are indicated below the x axis. Ref. is taken as [INFL] and [OXY0] on the first and second line, respectively.

