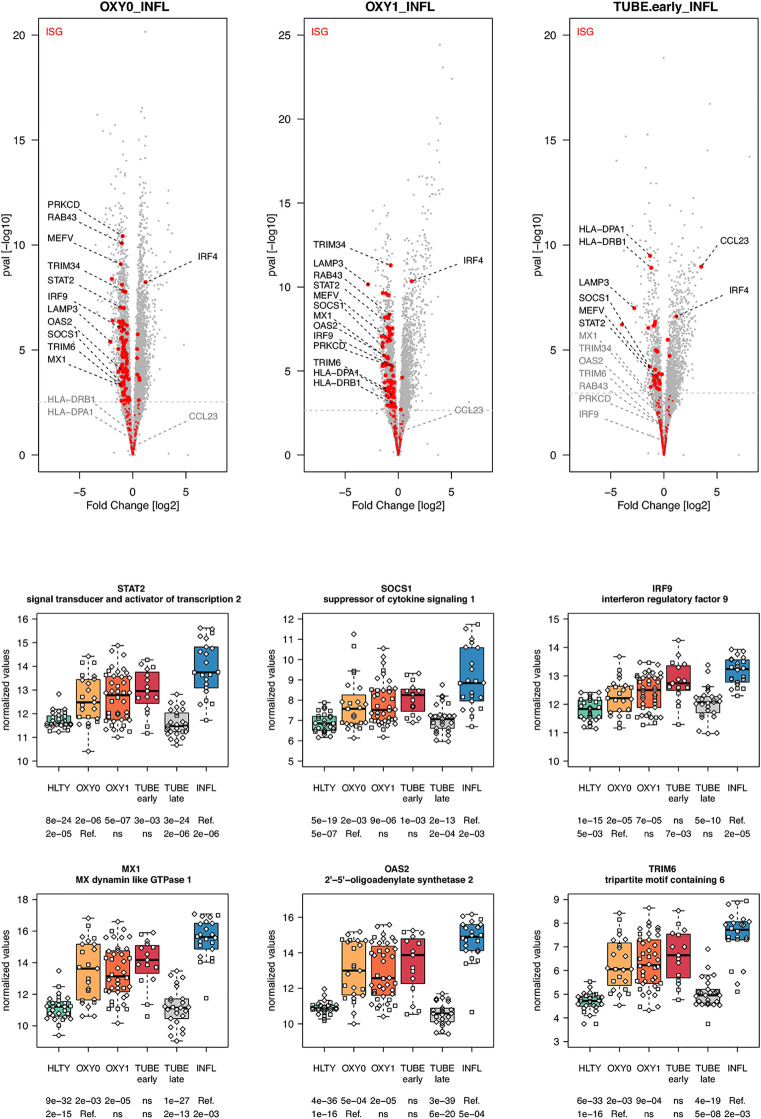
Figure 4.
Differentially expressed interferon-stimulated genes. Upper panel: for each comparison indicated in the volcano plot header, the distribution of log2 fold changes and P-values of all detected genes is shown as gray dots. Red dots indicate genes included in the ISGs (interferon-stimulated genes) gene set. Genes’ sets are selected from different GO, REACTOME and/or KEGG pathways (see Supplementary Table 2 ). The dotted horizontal gray line indicates the limit under which –log10(P-value) becomes non significant once adjusted for multiple testing (adjusted P > 0.01). Lower panel shows detailed expression levels of selected genes involved in IFN signal transduction and IFN stimulated genes in the different groups of patients. Groups used for comparisons include SARS-Cov-2 infected patients (no oxygen support [OXY0], oxygen support [OXY1], intubation with sampling within 7 days [TUBE early] or >7 days [TUBE late] after hospital admission), Influenza virus [INFL] infected patients and non-infected controls [HLTY]. Adjusted P-values of pairwise comparisons between a reference group (Ref.) and another group are indicated below the x axis. Ref. is taken as [INFL] and [OXY0] on the first and second line, respectively.

