Figure 3.
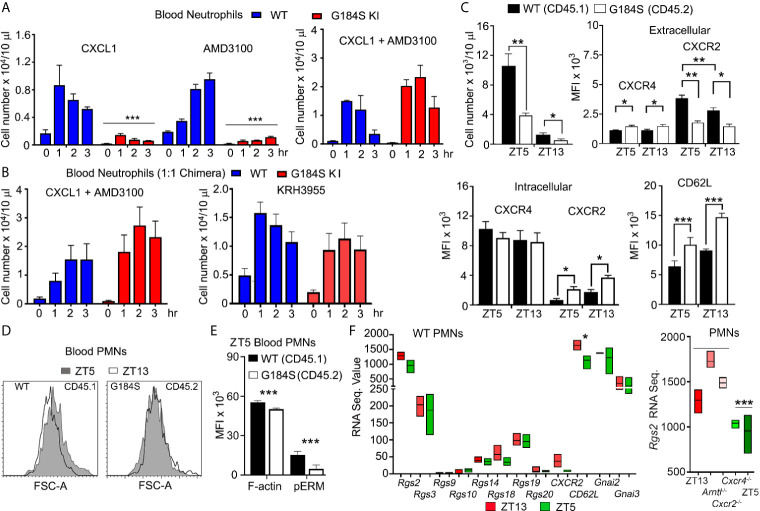
Poor neutrophil mobilization and disrupted neutrophil aging in G184S BM reconstituted mice. (A) Left graph, circulating blood neutrophil counts in WT vs G184S BM reconstituted mice after injections of CXCL1 (i.v.) or AMD3100 (i.p.). Blood neutrophil counts were monitored from 0 – 3 hours after CXCL1 or AMD3100 injections. Right graph, levels of circulating blood neutrophils in WT vs G184S BM reconstituted mice after injections of CXCL1 (i.v.) and AMD3100 (i.p.) 20 min apart. Blood neutrophil counts were monitored from 0 – 3 hours after CXCL1 + AMD3100 injections. (B) Circulating blood neutrophil counts in WT vs G184S 1:1 BM reconstituted mice after injection of either CXCL1 with AMD3100 (left) or KRH3955 alone (right). Blood neutrophil counts were monitored from 0 – 3 hrs after each treatment. (C) Top left graph, circulating WT vs G184S blood neutrophil count at ZT5 and ZT13. Top right graph, flow cytometry analysis of surface CXCR4 and CXCR2 expressions of WT vs G184S blood neutrophils at ZT5 (aged) and ZT13 (fresh). Bottom left graph, analysis of intracellular CXCR4 and CXCR2 levels. Data are expressed as mean fluorescence intensities (MFI). Bottom right graph, MFI data (left graph) obtained from flow cytometry analysis of surface CD62L levels of WT vs G184S blood neutrophils at ZT5 and ZT13. (D) Representative flow cytometry result comparing WT and G184S blood neutrophil forward light scatter. Blood neutrophils collected from 1:1 chimeric mice at ZT5 or ZT13 analyzed for forward light scatter. (E) Flow cytometry analysis of cortical actin and pEzrin levels of WT vs G184S blood neutrophils at ZT5. (F) Relative mRNA expression data obtained from RNA seq experiments. RNA sequence value (arbitrary unit) comparing RGS proteins, Cxcr2, CD62L, Gnai2, and Gnai3 mRNA expression levels of WT blood neutrophils at both ZT5 and ZT13. Right graph shows Rgs2 mRNA sequence data from neutrophils isolated from WT mice and from neutrophils lacking indicated genes. Statistics: data are means ± SEMs analyzed using unpaired Student’s t-test or 1-way ANOVA. *p < 0.05, **p < 0.005 and ***p < 0.0005.

