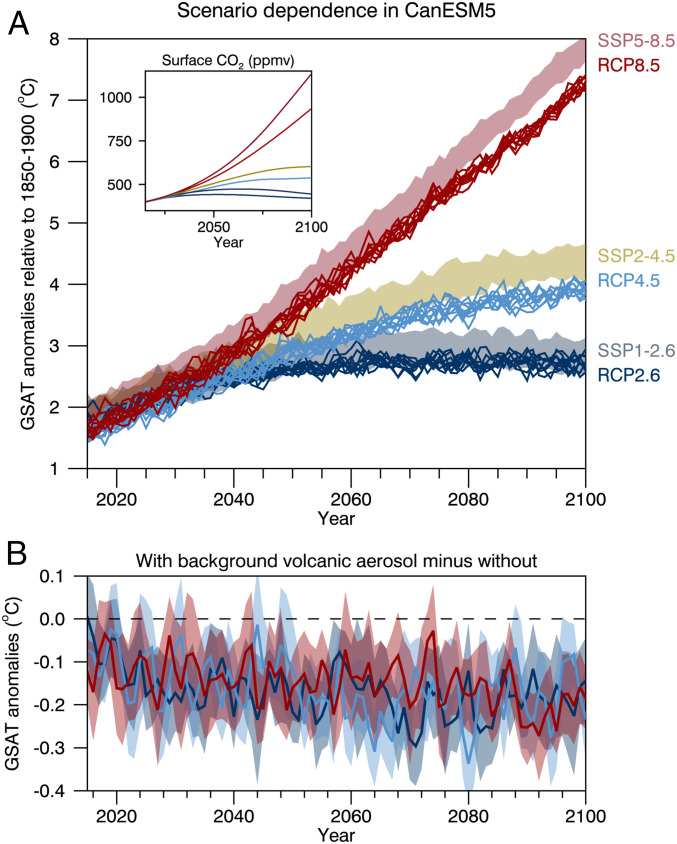
Fig. 4.
(A and B) Time series of anomalies in annual-mean and global-mean surface air temperature in a 50-member set of CanESM5 simulations employing SSP forcings and in a 10-member set employing RCP forcings (A) and differences between a 10-member set of CanESM5 simulations employing RCP forcings with and without background volcanic aerosols forcing (B). In A the colored shadings denote ranges across the simulations and colored lines indicate individual simulations. Inset shows the evolution of the prescribed annual-mean and global-mean carbon dioxide concentration near the surface. In B the solid colored curves are ensemble-mean differences and the gray shading is the 95% confidence interval on the ensemble-mean differences.

