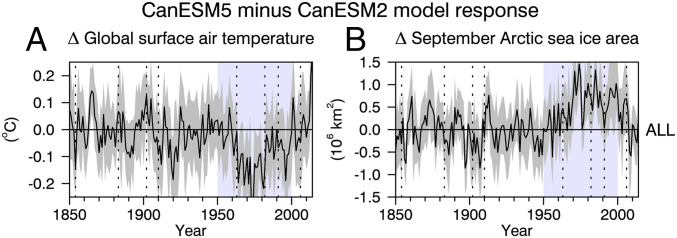
Fig. 5.
(A and B) Differences in annual-mean and global-mean surface air temperature (A) and September Arctic sea ice area (B) between a 10-member ensemble of CanESM5 simulations and a 5-member ensemble of CanESM2 simulations. Each simulation was run with the same CMIP5 forcings. The solid black curves are ensemble-mean differences and the gray shadings are 95% confidence intervals on the ensemble-mean differences. The vertical dotted lines are as in Fig. 1. The blue shaded period is the only extended time period when significant differences exist.

