Fig. 4.
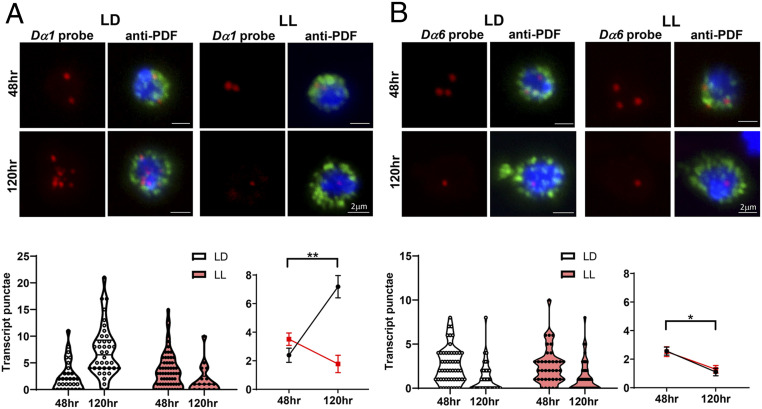
Dα1 and Dα6 transcript levels are temporally regulated during larval development. (A) The transcript level of Dα1 in the LNvs is regulated during development and influenced by activity. LL conditions eliminate the up-regulation of the Dα1 transcript at the wandering third instar stage. (Top) Representative projected confocal images of qFISH experiments labeling Dα1 mRNA transcripts (red) in acutely dissociated LNvs (green) are shown. Cell nuclei are stained with DAPI (blue). The LNvs were collected from larvae at two developmental stages. (Bottom) Quantification of the Dα1 transcript level represented by the violin plot (Left), and the trend line (Right) reveals a significant increase at the later developmental stage when larvae are cultured in the LD condition (black) but not the LL condition (red). n represents the number of dissociated LNvs. n = 18 to 62 in all groups. (B) Dα6 transcript level is down-regulated during larval development and is not sensitive to changes in activity. (Top) Representative projected confocal images of qFISH experiments labeling Dα6 mRNA transcripts (red) in acutely dissociated LNvs (green) with DAPI-stained nuclei (blue). (Bottom) Quantifications of the Dα6 transcript level by violin plot (Left) and line plot (Right) reveal a significant reduction of LNv transcripts in both LD and LL conditions. n represents number of dissociated LNvs. Samples were collected at 48 and 120 h AEL. n = 39 to 54 in all groups. Statistical significance is assessed by one-way ANOVA followed by Tukey’s post hoc test. *P < 0.05, **P < 0.01. Error bars represent mean ± SEM. Scale bars are as indicated.

