
Fig 2. [18F]Florbetapir time–activity curves in the lungs.
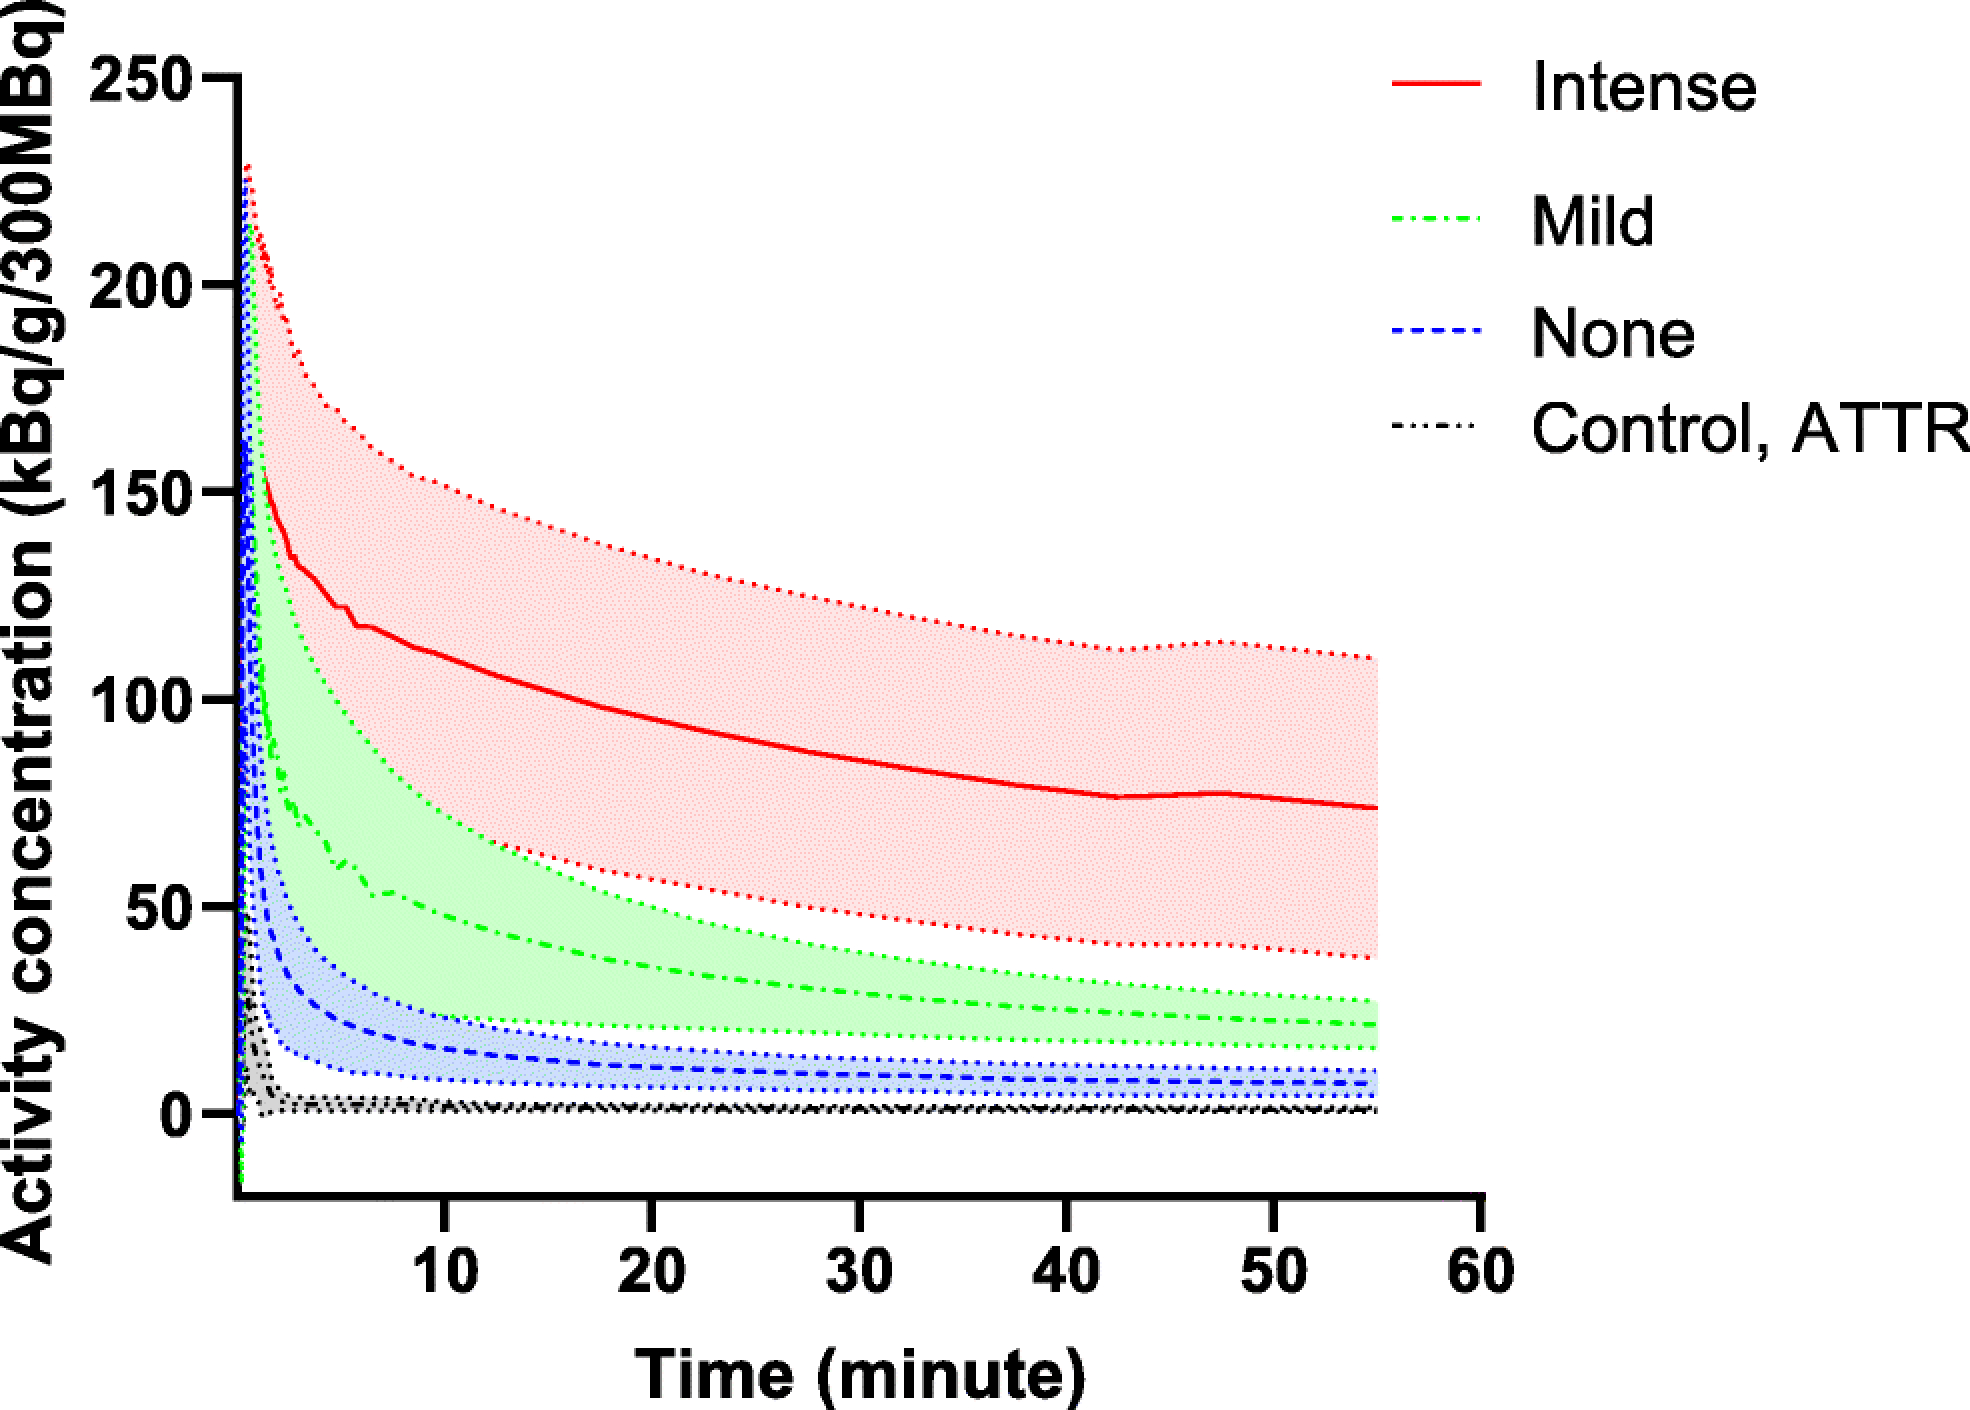
The rate of [18F]florbetapir tracer washout was slowest in subjects with intense uptake and fastest in the control subjects. Shaded area represents standard deviation
Official websites use .gov
A
.gov website belongs to an official
government organization in the United States.
Secure .gov websites use HTTPS
A lock (
) or https:// means you've safely
connected to the .gov website. Share sensitive
information only on official, secure websites.
The rate of [18F]florbetapir tracer washout was slowest in subjects with intense uptake and fastest in the control subjects. Shaded area represents standard deviation