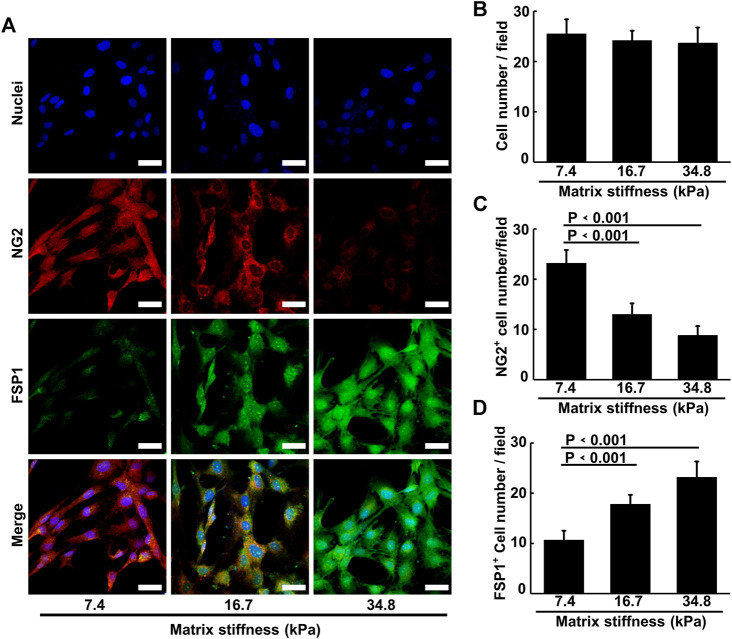
FIGURE 5.
Matrix stiffness induces pericyte-fibroblast transition. (A) Representative immunofluorescence images of pericytes on different matrices stained with NG2 and FSP1 antibody. Cell nuclei were stained with DAPI. Scale bar is 20 um. (B) Statistical analysis of pericyte cell numbers in each image field. (C) Statistical analysis of NG2 positive pericyte cell numbers in each field. (D) Statistical analysis of FSP1 positive pericyte cell numbers in each field.

