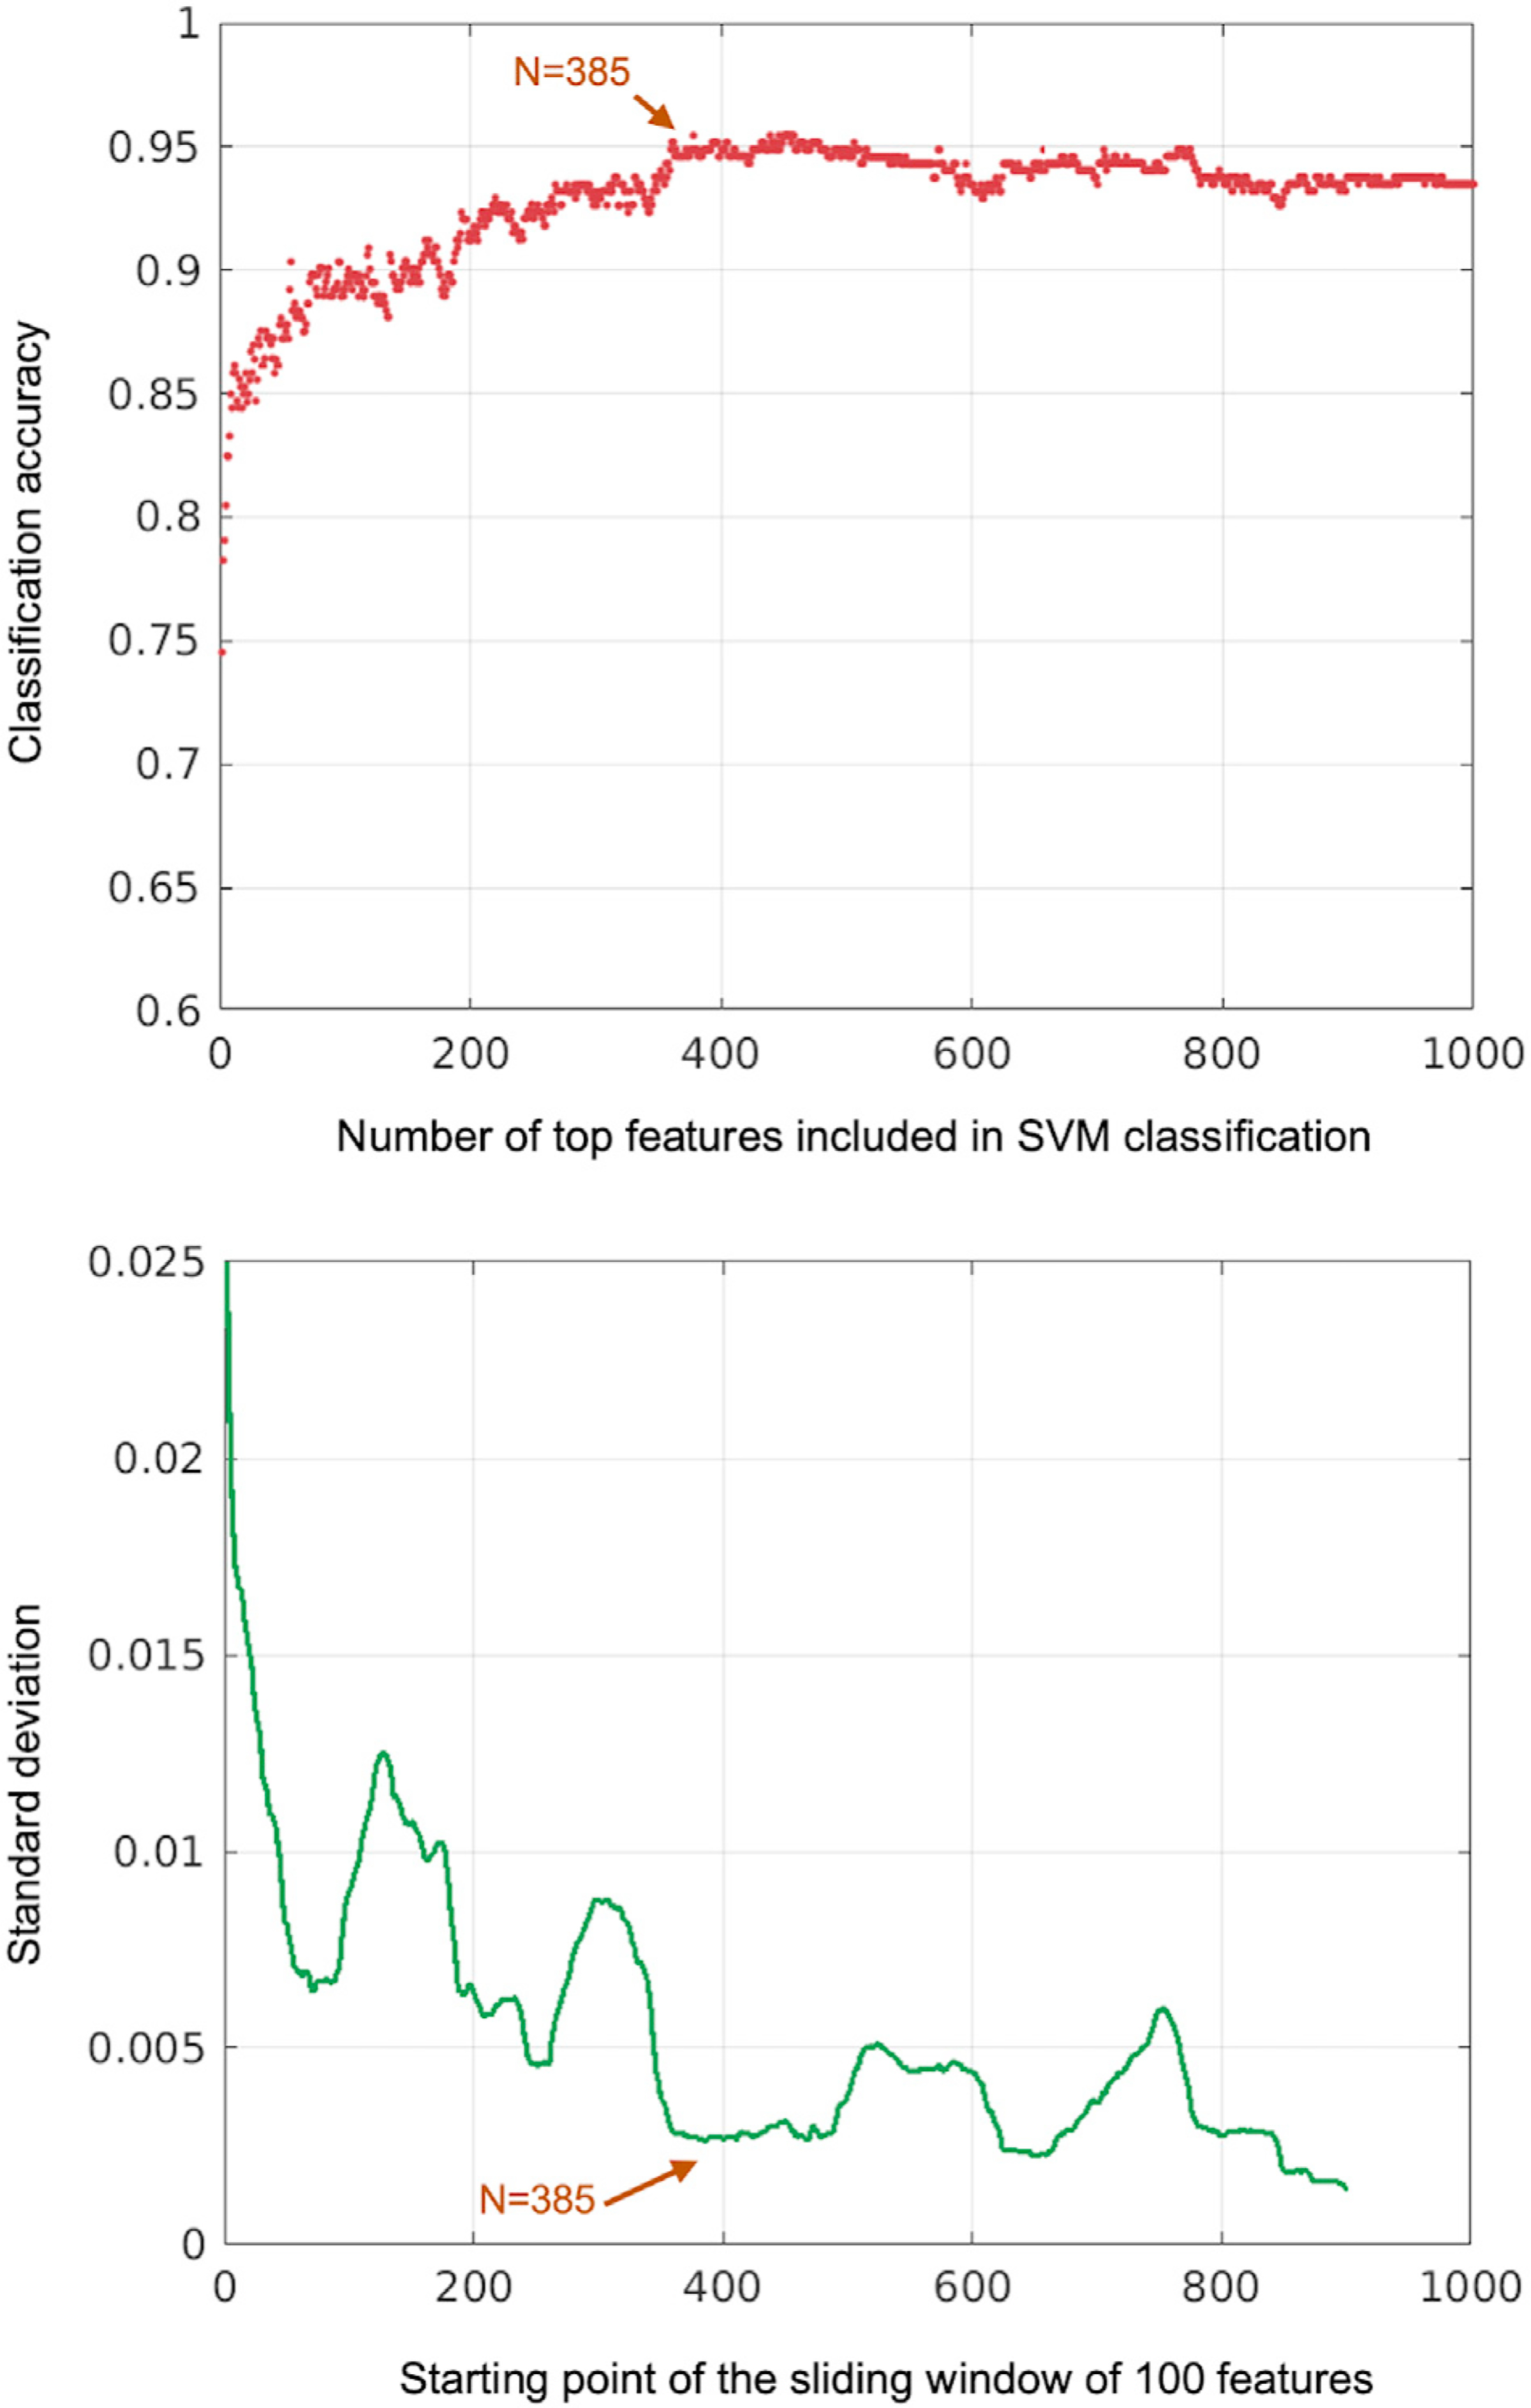
Fig. 3.

Classification accuracy vs. number of top features included in the SVM analysis. The upper panel shows mean classification accuracy obtained via 5-fold cross validation on SVM classification as a function of top N features included in the analysis. The lower panel shows the standard deviation of mean classification accuracy over a sliding window of 100 features (from top 1–100 to 901–1000). The arrows demonstrate a local minimum (N = 385), where the classification accuracy reaches a stable point.
