
Fig. 5.
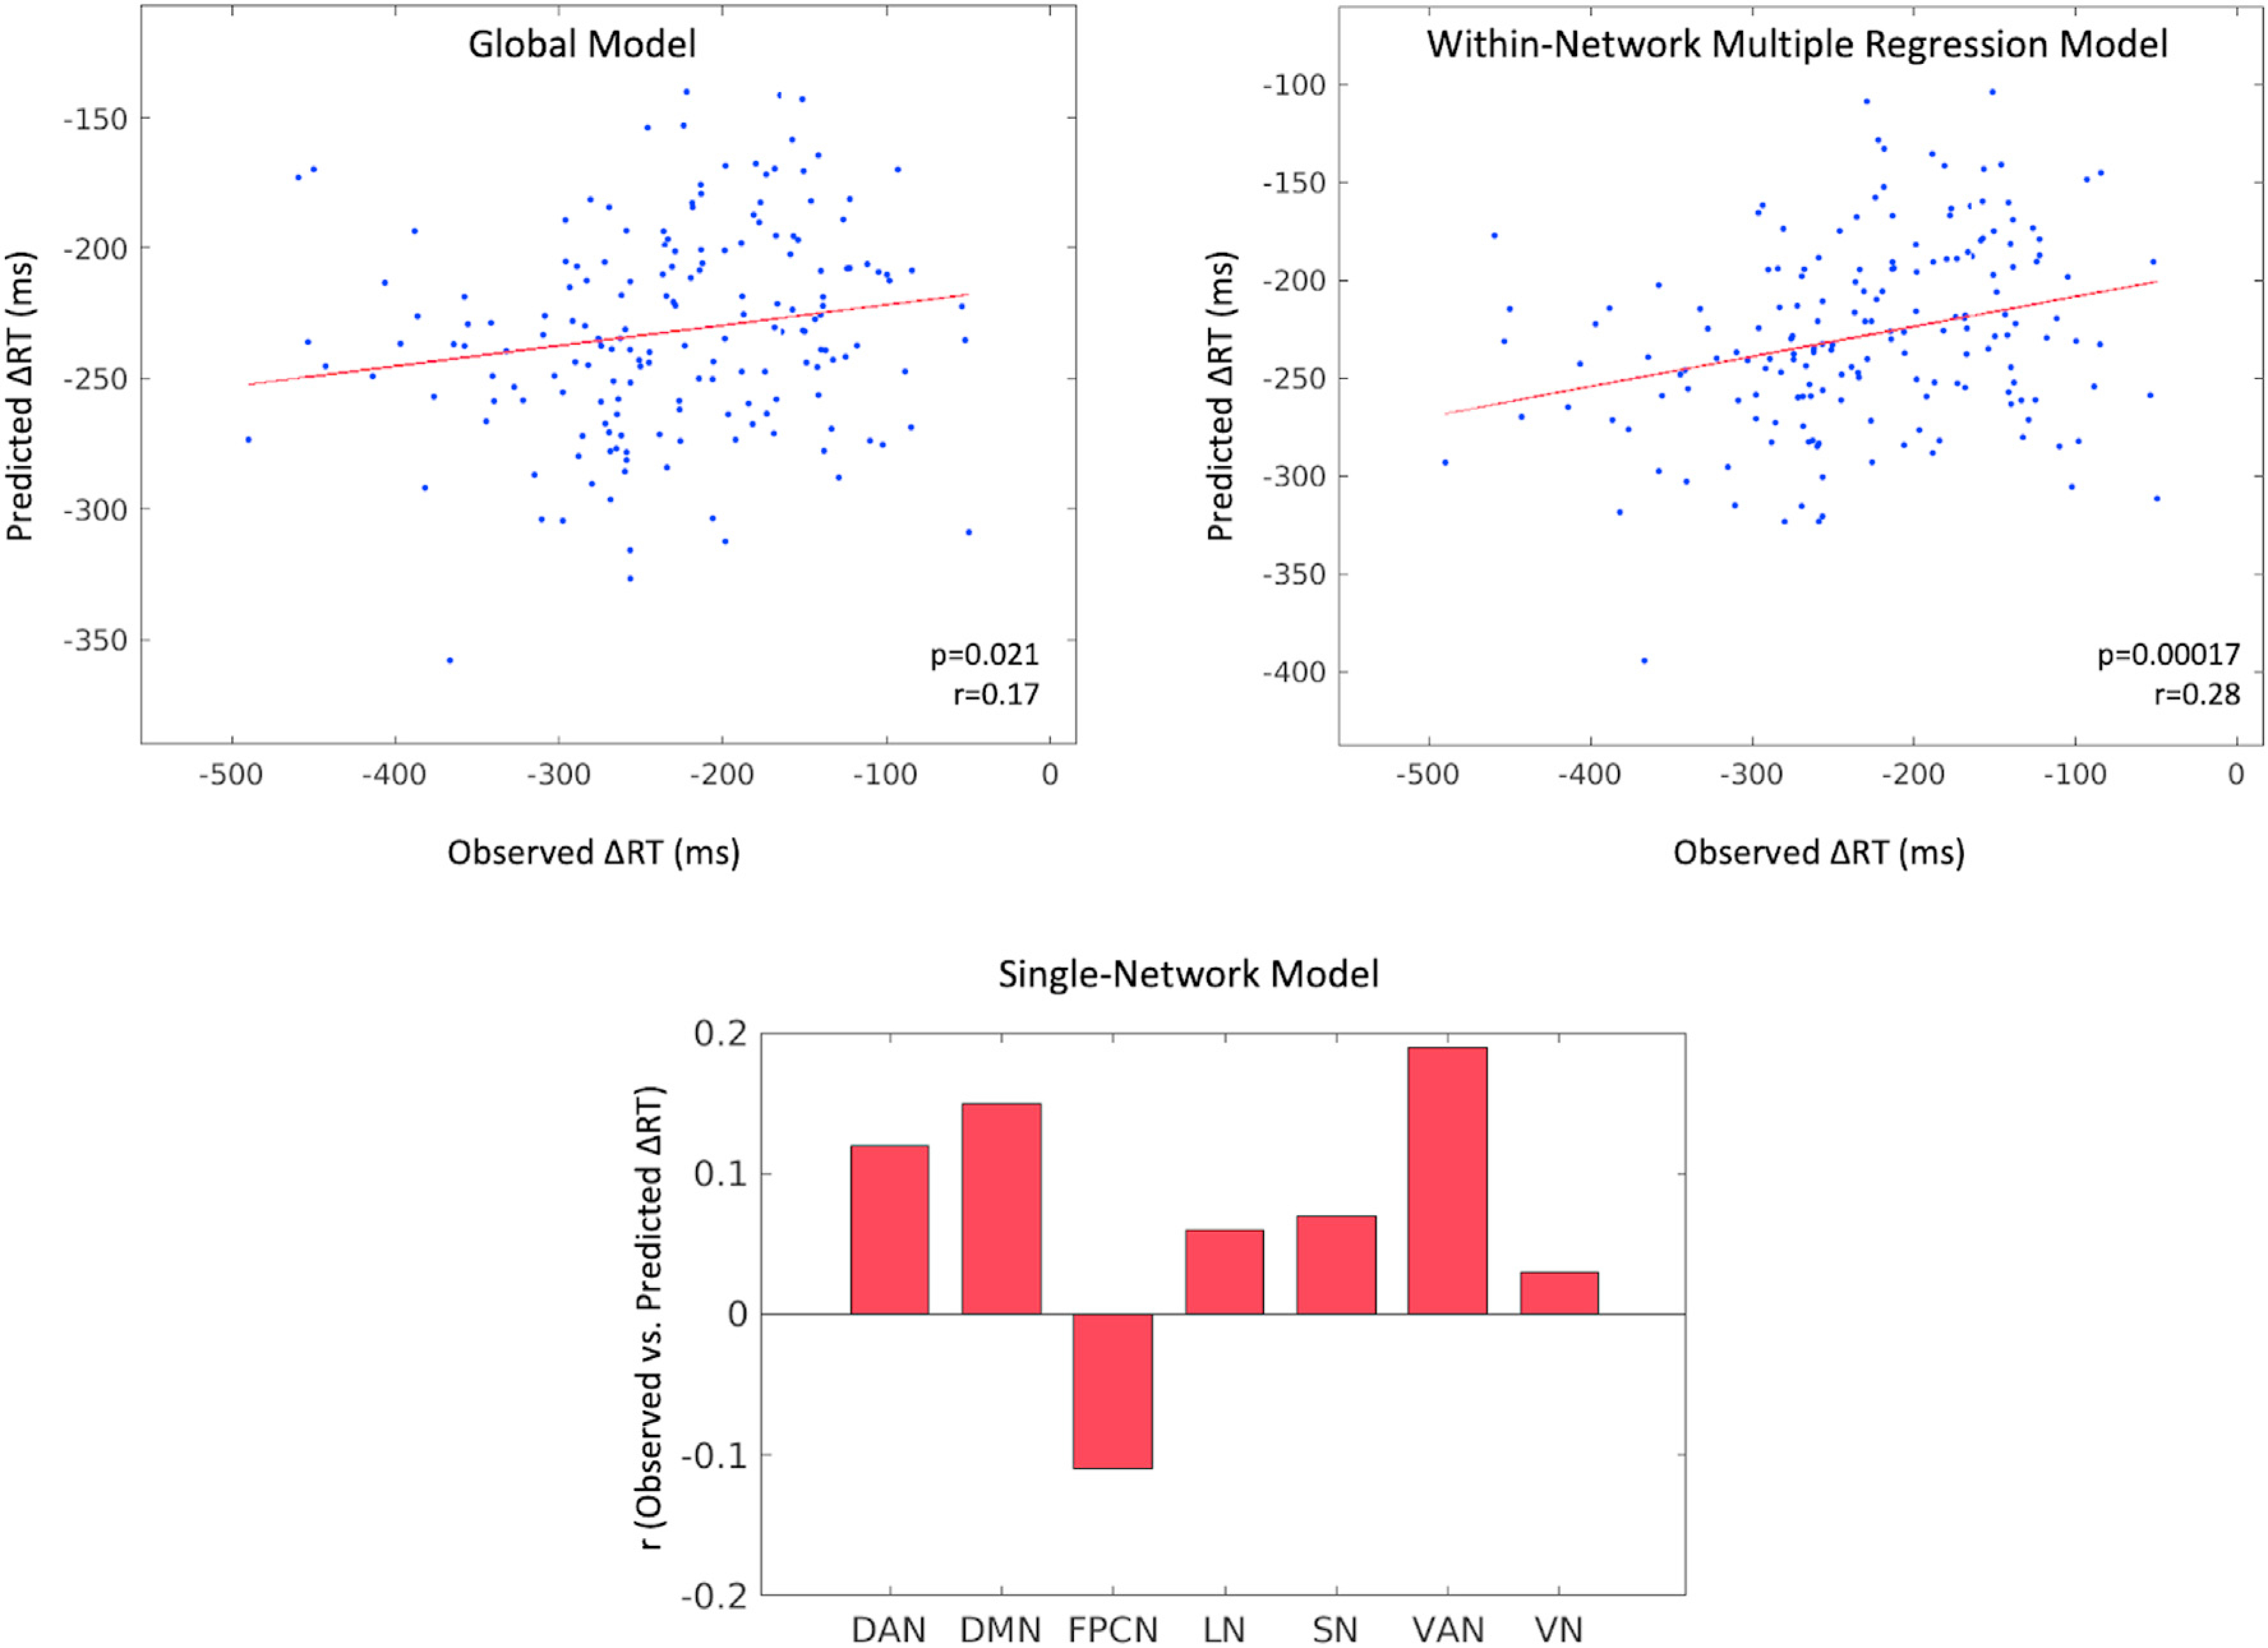
Relationship between connectivity and behavior obtained via an iterative, cross-validated prediction analysis. On the top panel, predicted vs. observed ΔRT values are displayed for the two models that used all possible edges and all within-network edges respectively in the feature selection step. Each dot represents a subject. The bar graph in the bottom panel shows the correlation (r) between observed and predicted ΔRTs for each of the 7 single-network models restricting feature selection to 7 respective within-network feature sets. All plots reflect results from positive feature sets.