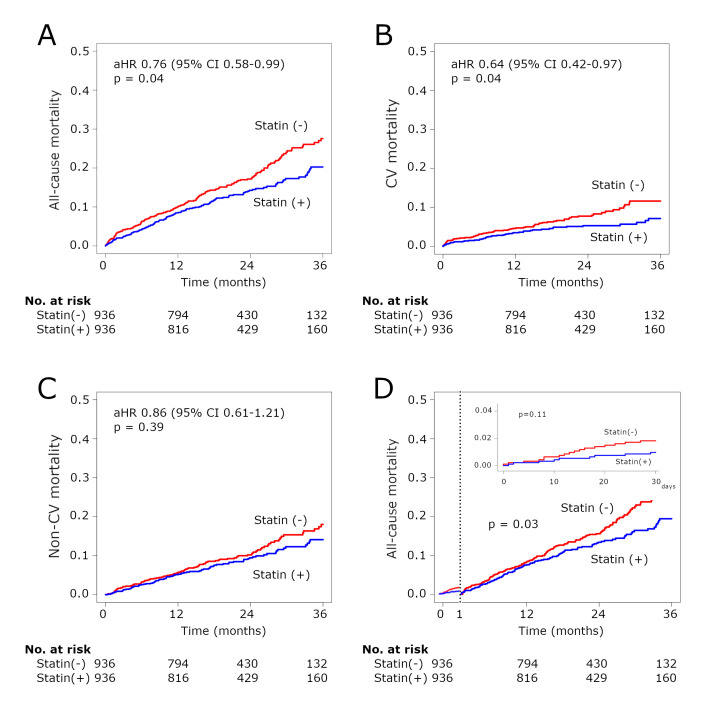
Figure 2.
Kaplan-Meier curves for midterm and 30-day mortality in the matched cohort. Kaplan-Meier curves for midterm all-cause mortality (A), CV mortality (B) and non-CV mortality (C) in the matched cohort. (D) Kaplan-Meier curve for 30-day all-cause mortality and midterm all-cause mortality with the landmark analysis from 30 days in the matched cohort. aHR, adjusted HR; CV, cardiovascular.

