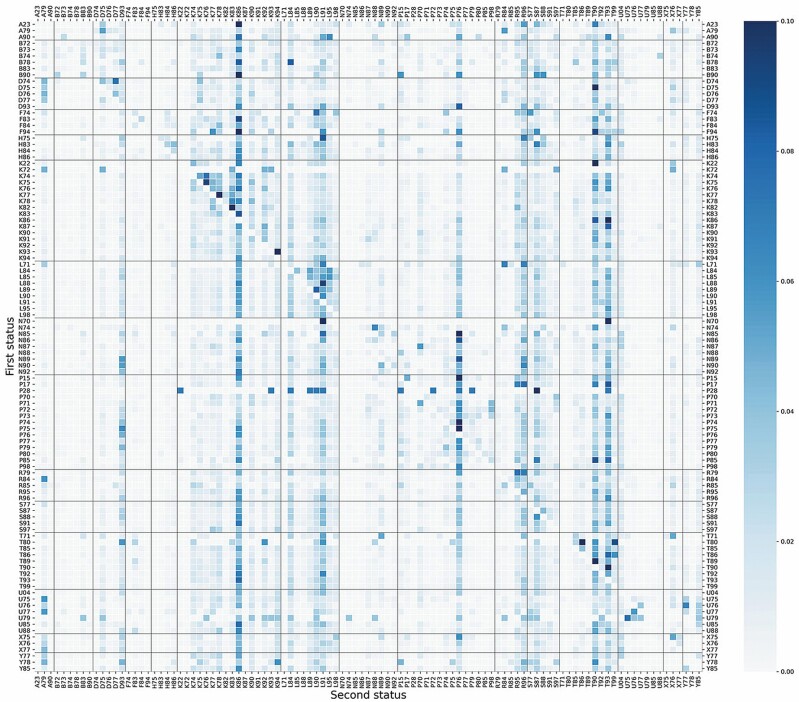
Figure 1.
Heatmap of the first-order transition probability matrix of a Markov chain including 103 chronic conditions. The number in each square is the probability of developing the condition on the x-axis after the diagnosis of the condition on the y-axis. The scale of the color bar was defined between 0 and 0.1. Vertical and horizontal lines were added for disease groups. (Disease groups: A, general; B, blood and immune; D, digestive; F, eye; H, ear; K, cardiovascular; L, musculoskeletal; N, neurological; P, psychological; R, respiratory; S, skin; T, metabolic; U, urological; X, female genital; Y, male genital.)

