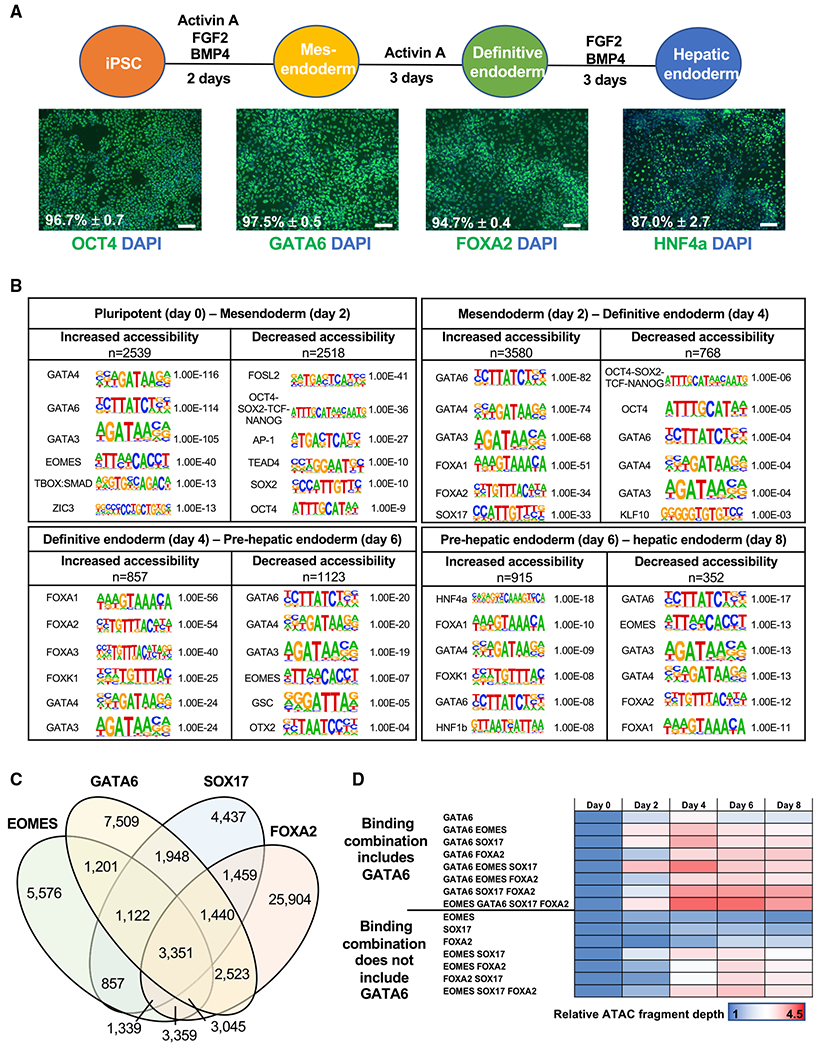
Figure 1. Differentially accessible chromatin during endoderm formation and hepatic specification.

(A) Differentiation protocol used to study endoderm formation and hepatic specification. immunofluorescence analysis of stage specific markers. Scale bars, 100 μm. Positive cell population: flow cytometry analysis, n = 3, mean ± SD. See Figure S1A for histograms.
(B) Transcription factor motif enrichment at differentially accessible chromatin at 48-h intervals. n = sequences analyzed. p values: hypergeometric enrichment test using HOMER default background. See Table S1.
(C) Venn diagram showing the sites co-bound by GATA6, EOMES, SOX17, and FOXA2 in definitive endoderm using previously published ChIP-seq datasets (Tsankov et al., 2015).
(D) ATAC-seq fragment depth during endoderm formation and hepatic specification relative to day 0 values at the identified combinations of transcription factor binding.
Related to Figure S1D and Table S2.
