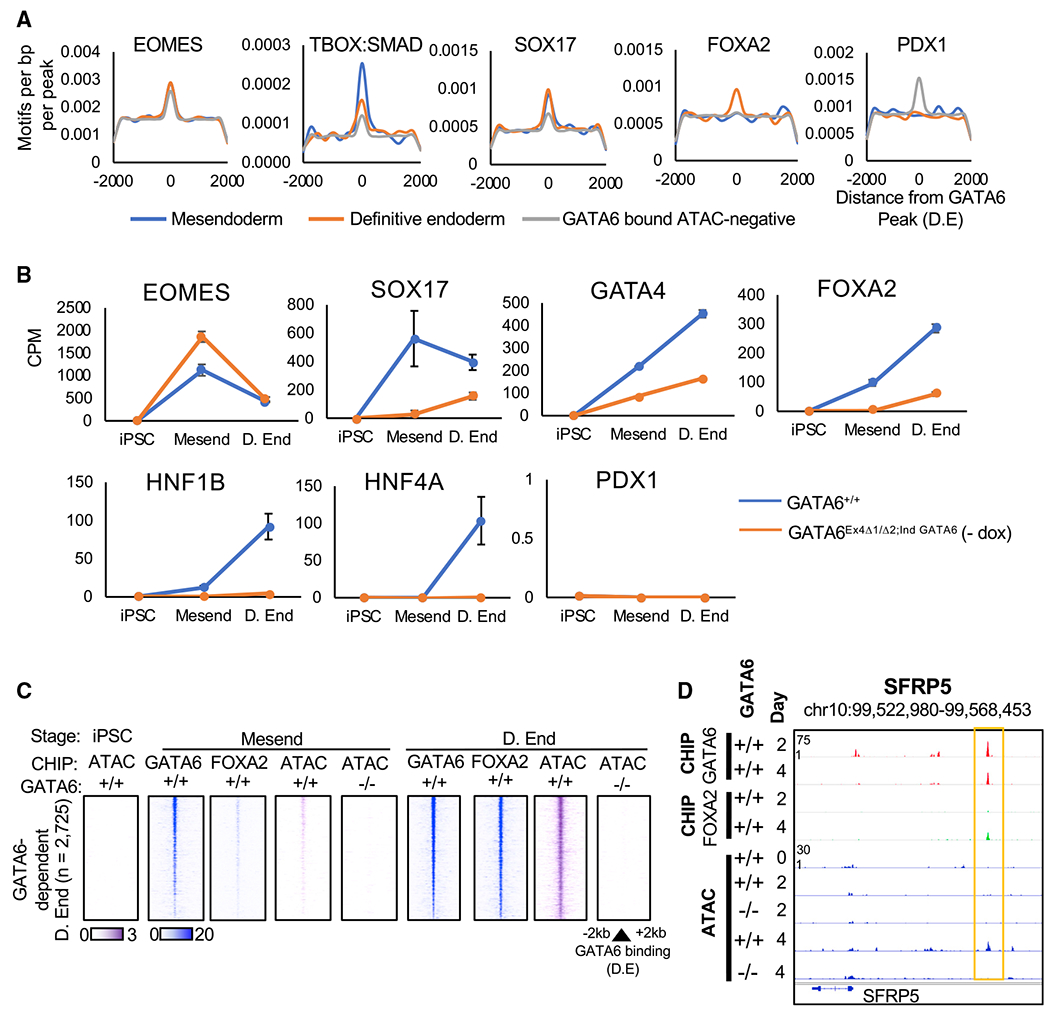
Figure 4. Endoderm transcription factors are co-enriched at sites of GATA6-dependent chromatin accessibility.

(A) Histograms showing density of specific motifs and their proximity to the GATA6 binding loci in definitive endoderm at sites with or without GATA6-dependent increases in chromatin accessibility. See also Table S4.
(B) mRNA expression data of co-regulators in GATA6+/+ and GATA6Ex4Δ1/Δ2;ind GATA6 cells during definitive endoderm formation; RNA-seq normalized by counts per million (CPM, n = 2, mean ± SD).
(C) Heatmaps depicting temporal GATA6 and FOXA2 ChIP-seq intensity (blue) and ATAC-seq (purple) at sites of slow-onset GATA6-dependent chromatin remodeling.
(D) GATA6 and FOXA2 ChIP-seq data aligned with ATAC-seq profiles during definitive endoderm formation at the SFRP5 gene loci in GATA6+/+ cells.
