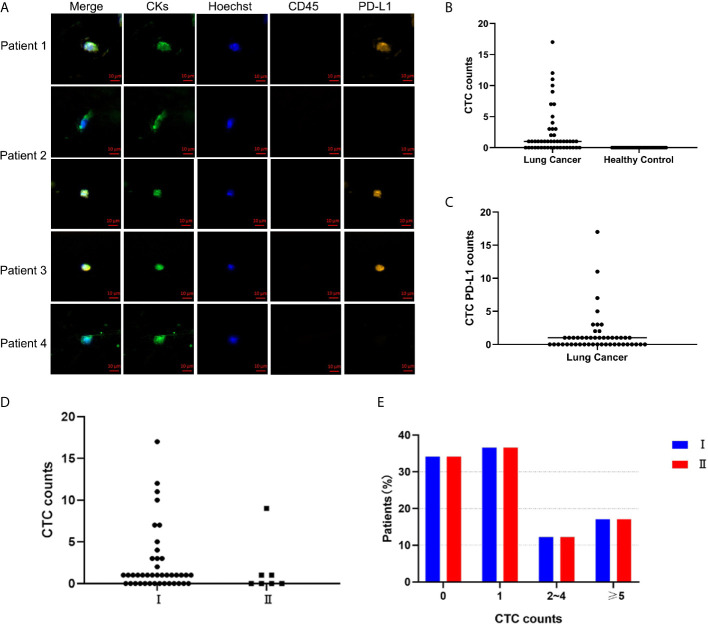
Figure 1.
CellCollector captures representative CTC graphs and CTC and CTC PD-L1 detection. (A) CellCollector captures CTC identification charts. Patient 1 captures 7 CTCs, patient 2 captures 3 CTCs, patients 3 and 4 capture 1 CTC. (B) Detection rate and number of CTC in lung cancer patients and healthy controls. (C) Detection rate of PD-L1+ CTC in patients with lung cancer. (D) Detection rate and number of CTC in stage I and stage II lung cancer patients. (E) Distribution of detected CTCs in stage I and stage II patients.

