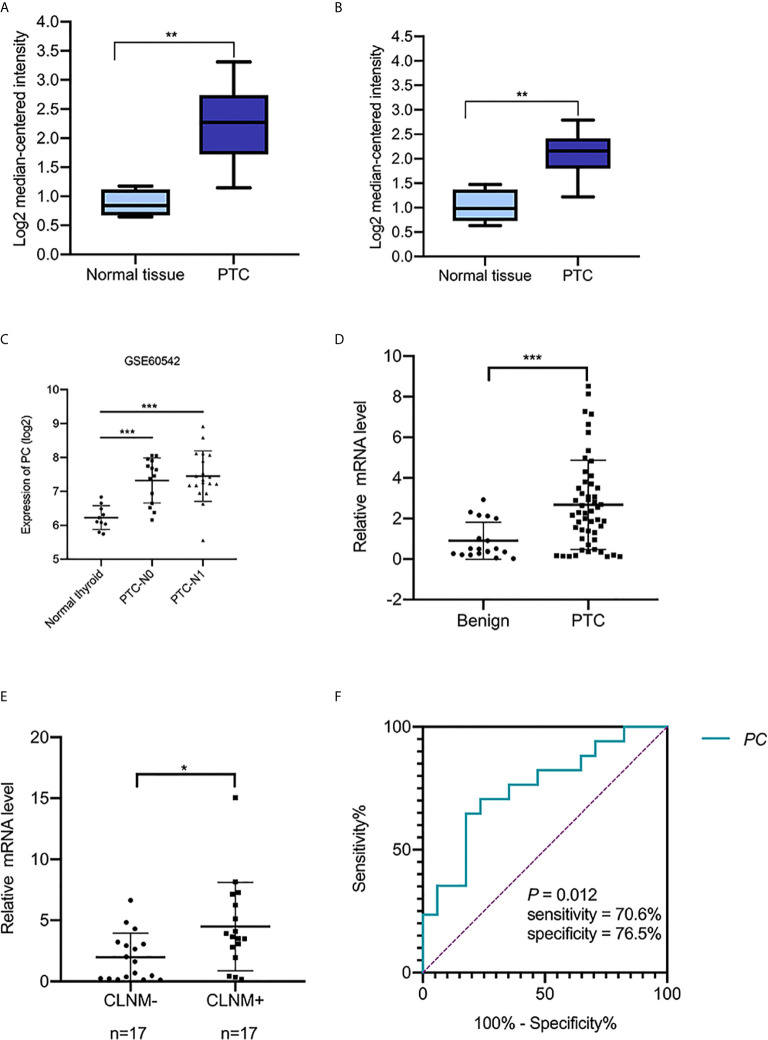
Figure 2.
The transcript levels of PC in the Oncomine and GEO datasets and RT-PCR analysis of PC mRNA expression levels in thyroid FNA wash-out fluid. (A) PC level in the THCA dataset (Vasko’s dataset), (** P <0.01). (B) PC levels in the THCA dataset (He’s dataset), (** P <0.01). (C) PC levels in THCA dataset (GSE60542). ***P <0.001 (D) The expression of PC in 52 PTC FNA wash-out fluid samples and 19 benign nodule FNA wash-out fluid samples based on cytological diagnosis was examined using RT-PCR assays. **P <0.01. (E) Expression of PC in 34 surgically diagnosed PTCs from patients with or without CLNM. *P <0.05. (F) AUC for identifying PTC with CLNM using the PC mRNA expression level. The AUC was 0.751 (P = 0.012; 95% CI, 0.585–0.917). AUC, area under the receiver operating characteristic curve; PC, pyruvate carboxylase; PTC, papillary thyroid carcinoma; PTC-N0, papillary thyroid carcinoma without lymph metastasis; PTC-N1, papillary thyroid carcinoma with lymph metastasis; CLNM, central lymph node metastasis; CI, confidence interval.

