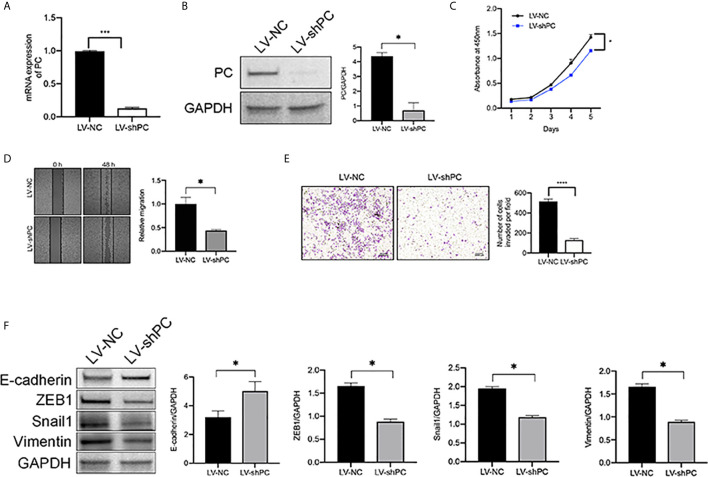
Figure 4.
PC knockdown inhibit the migration and invasion of PTC cells. (A) qRT-PCR analysis of PC mRNA expression in the PTC cell line (TPC1) as indicated. ***P <0.001 (B) Western blotting was used to evaluate PC protein expression in TPC1 cells as indicated. The average quantification obtained by densitometric analysis (Image J) of the blot of PC expression. Data are expressed as mean ± SEM. *P <0.05. (C) CCK-8 assay was used to detect the proliferation of the indicated TPC1 cells. *P <0.05. (D) A wound-healing assay was applied to assess the migration ability of different TPC1 cells (LV-NC, LV-shPC). Representative images and quantification of cell counts normalized by controls are shown. *P <0.05 (E) Transwell invasion assays were applied to assess the motility of different TPC1 cells with a 4× objective lens. ****P <0.0001. The number of invaded cells is shown in histograms on the right. (F) Western blot analysis of E-cadherin, Snail1, Vimentin, and ZEB1 expression in LV-NC cells compared with LV-shPC cells. The average quantification obtained by densitometric analysis (Image J) of the blot of proteins expression. Data are expressed as mean ± SEM. *P <0.05. The full blot is provided in the Supplementary File .

