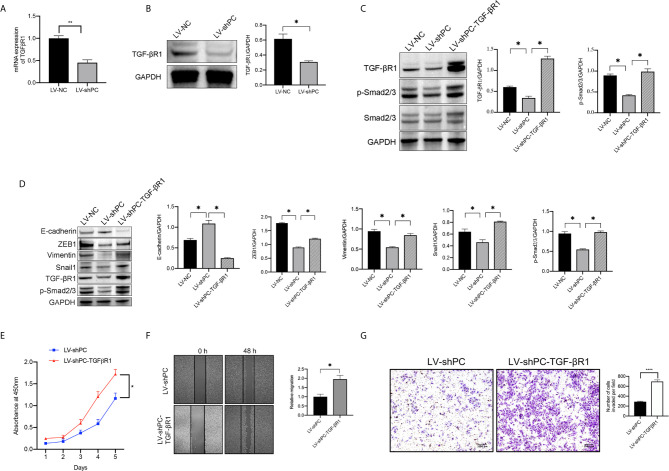
Figure 5.
PC induces EMT in PTC cells by activating the TGF-β/Smad signaling pathway. (A) qRT-PCR analysis of TGF-βR1mRNA expression in TPC1 cells as indicated. **P <0.01 (B) Western blotting was used to evaluate TGF-βR1 protein expression in TPC1 cells as indicated. The average quantification obtained by densitometric analysis (Image J) of the blot of TGF-βR1 expression. Data are expressed as mean ± SEM. *P <0.05. (C) Western blot analysis of TGF-βR1, P-Smad2/3, and Smad2/3 protein expression in TPC1 cells as indicated. The average quantification obtained by densitometric analysis (Image J) of the blot of proteins expression. Data are expressed as mean ± SEM. *P <0.05. (D) Western blotting was used to evaluate E-cadherin, Vimentin, ZEB1, Snail1, TGF-βR1, and P-Smad2/3 protein expression in TPC1 cells as indicated; The average quantification obtained by densitometric analysis (Image J) of the blot of proteins expression. Data are expressed as mean ± SEM. *P <0.05. The full blot is provided in the Supplementary File . (E) CCK-8 assay was used to detect the proliferation of the indicated TPC1 cells. *P <0.05. (F) A wound-healing assay was applied to assess the migration ability of different TPC1 cells (LV-sh, LV-shPC- TGF-βR1). Representative images and quantification of cell counts normalized by controls are shown. *P <0.05 (G) Transwell invasion assays were applied to assess the motility of different TPC1 cells with a 4× objective lens. ****P <0.0001. The number of invaded cells is shown in histograms on the below.

