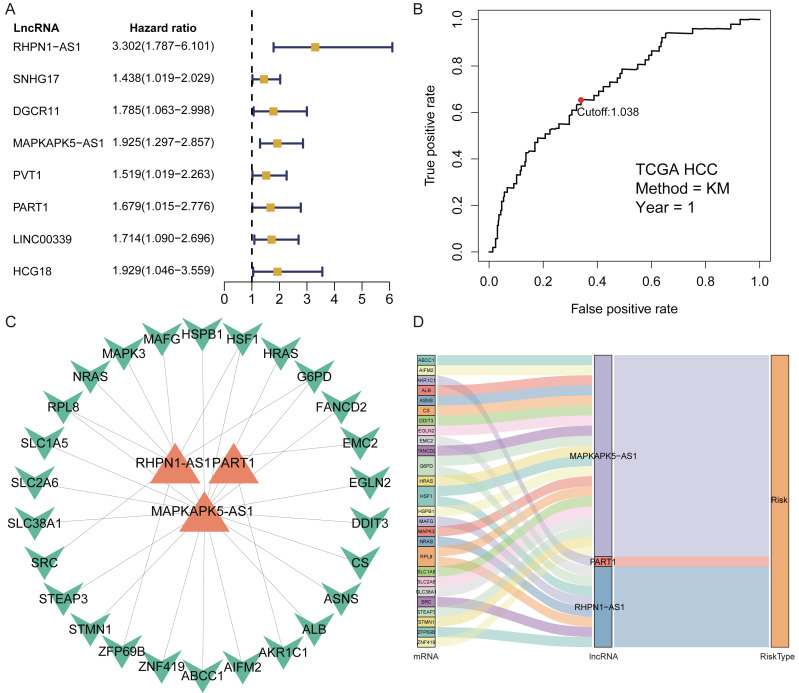
Figure 2. Identification of prognostic Ferroptosis-related lncRNAs (FRlncRNAs).
(A) Forest plots revealed prognosis-related FRlncRNAs based on the results of univariate Cox regression. (B) ROC curve for FRlncRNAs signature at 1 year in training cohort. The cut-off score was 1.038 and it was utilized to classify patients into high- or low-risk groups. (C) The relational network between signature and corresponding co-expression ferroptosis-related genes. (D) Sankey diagram indicated that the association between prognostic FRlncRNAs, ferroptosis-related genes, and risk type.

