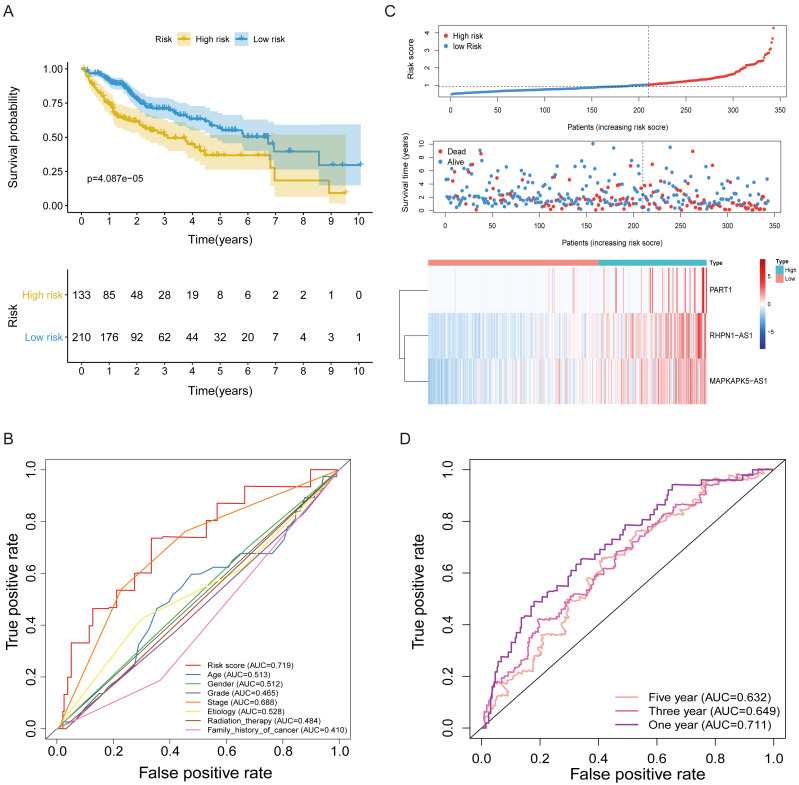
Figure 3. The FRlncRNAs signature based on training cohort.
(A) Kaplan–Meier (KM) curve for overall survival (OS) of patients with HCC in high- and low-risk group in training cohort. (B) The AUC values of the risk score and additional clinical characteristics. (C) Risk survival status plot in patients with HCC. (D) ROC curves at 1, 3, 5-year were applied to verify prognostic performance of FRlncRNAs signature established by training cohort.

