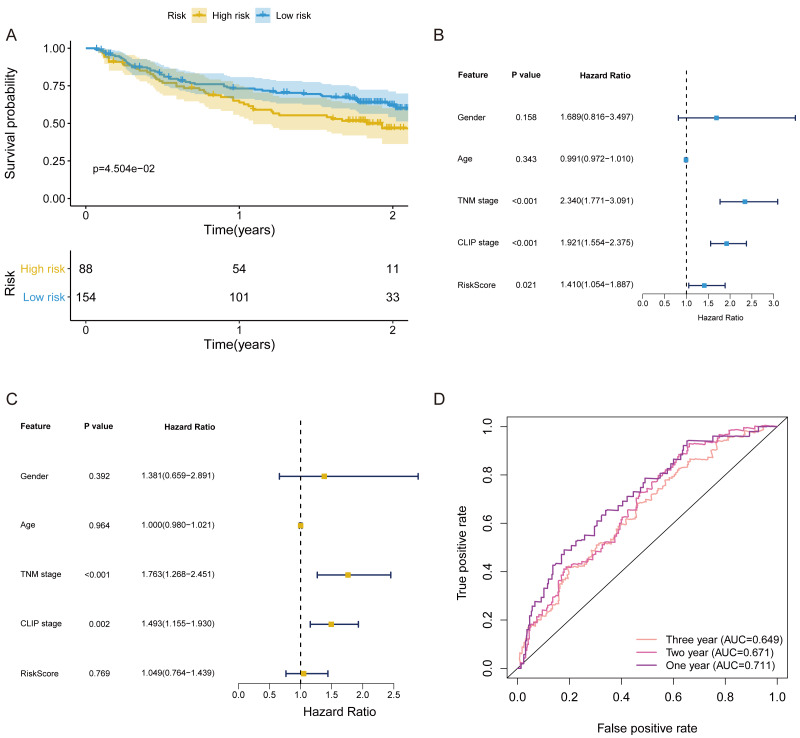
Figure 6. The verification of prognostic FRlncRNAs signature in validation cohort.
(A) The KM curves of validation cohort revealed that the high-risk group had statistical differences on OS period compared with the low-risk group (P < 0.05). Univariate (B) and multivariate (C) COX regression for the FRlncRNAs signature established by training cohort. (D) AUC of ROC curves validated the predicted performance of signature in the validation cohort.

