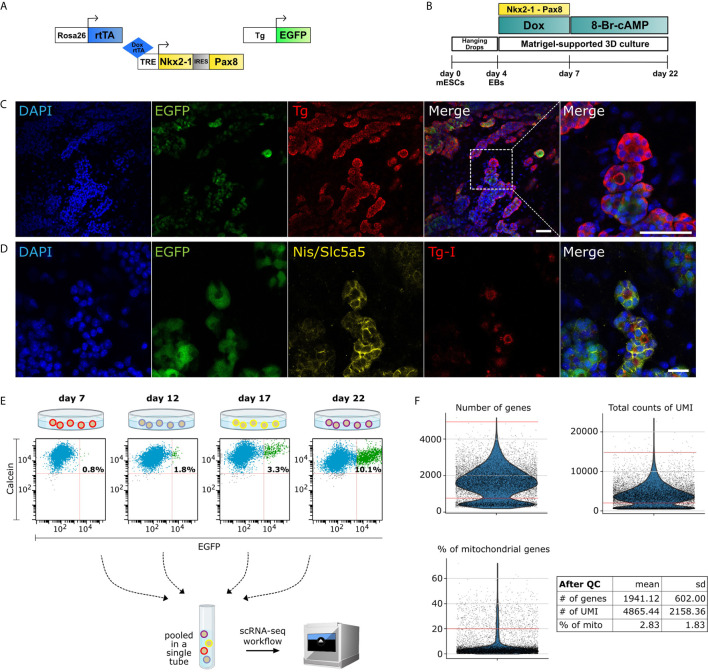
Figure 1.
Single-cell RNA-Seq of mouse organoid. (A) Schematic of the three constructs used in the protocol: Rosa26 locus driven reverse tetracycline-controlled transactivator (rtTA), Tet-Responsive Element (TRE) driven Nkx2-1 and Pax8, and Tg promoter driven EGFP. (B) Schematic of differentiation protocol for mESC-derived in vitro thyroid organoid. (C) Immunofluorescence images from cells at day 22 displaying differentiated organoids marked with DAPI (blue), EGFP (green) and Thyroglobulin (Tg) (red). Zoomed image shows spheric thyroid follicles (Scale bars: 50 µm). (D) In addition, thyroid follicles express functional markers as Slc5a5/Nis (yellow) and Tg-I (red) (Scale bar: 20 µm). (E) Cells from differentiated organoids at days 7, 12, 17 and 22 were collected on the same day and labeled with calcein (live cell marker) and FACS-sorted for scRNA-seq analysis. Percentage of EGFP+ thyrocytes are noted. For downstream analysis, EGFP+ and EGFP- cells (1:1 ratio) from day 12, 17 and 22 (at day 7 no GFP+ enrichment was performed) were pooled into a single tube and sequenced using 10X Genomics platform. (F) Violin plots showing the quality control parameters for cells profiled using scRNA-seq. Number of genes, total counts of UMI and the percentage of mitochondrial genes were utilized for quality control. Red lines on violin plots depict the cutoffs for filtered cells. After filtration, cells from scRNA-seq had a mean ± standard deviation of 1941 ± 602 genes, 4865 ± 2158 UMIs and 2.83 ± 1.83% of mitochondrial gene content.

