Figure 2.
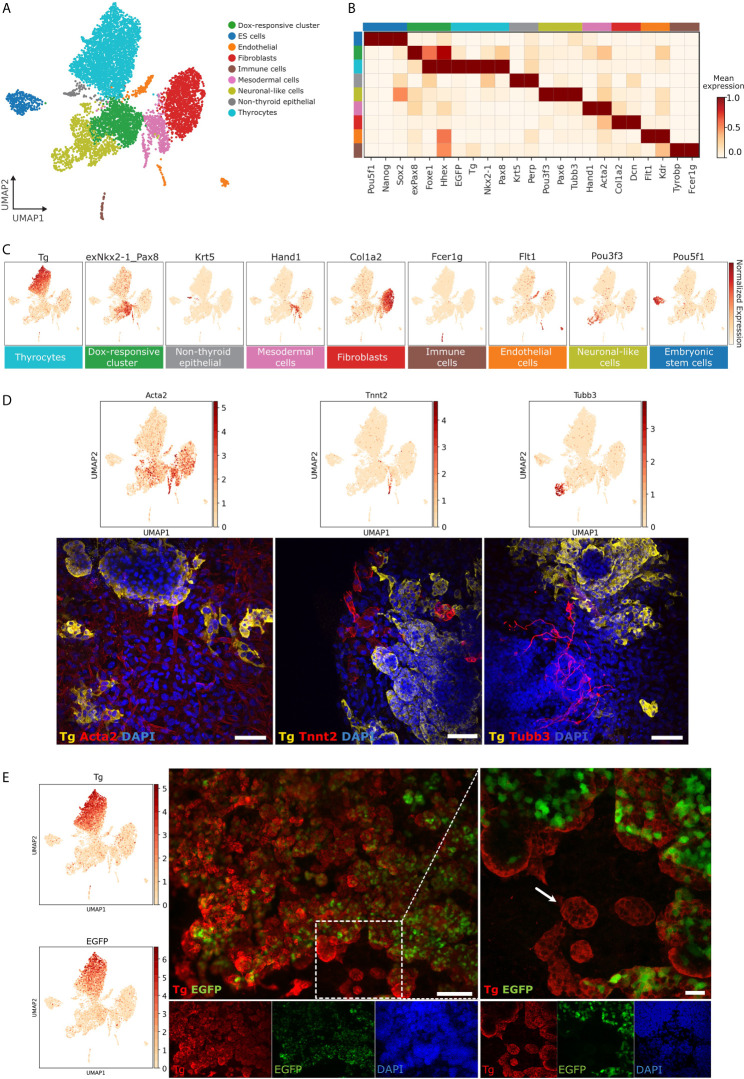
Characterization of cell types present in thyroid organoids. (A) Unsupervised clustering of in vitro thyroid organoid model. Each cluster is represented by a specific color. (B) Gene-expression matrix plot for selected marker genes for each cell cluster. Rows depict cell clusters, while columns depict genes. The intensity of color in each square indicates mean expression within the cluster. (C) UMAP expression plots of representative marker genes for thyrocytes (Tg), Dox-responsive cluster (exNkx2-1_Pax8), Non-thyroid epithelial cells 1 (Krt5), Mesodermal cells (Hand1), Fibroblasts (Col1a2), Immune cells (Fcer1g), Endothelial cells (Flt1), Neuronal-like cells (Pou3f3) and Embryonic stem cells (Pou5f1). Color intensity indicates normalized expression of respective genes. (D) Immunofluorescence-based detection of specific non-thyroid cell-types at differentiation day 22. For mesenchymal cell population, fibroblasts were labeled with smooth muscle actin (Acta2; red) while cardiomyocytes were marked with Troponin T (Tnnt2; red). Thyroid follicles were labeled with antibody against Thyroglobulin (Tg; yellow). Neurons were confirmed by staining for beta-III tubulin (Tubb3; red). (E) To evaluate the extent of bovine Tg promoter driven GFP expression in thyroid follicular cells, organoid culture at differentiation day 22 was stained for Tg (red). A fraction of Tg-expressing cells do not express EGFP (Zoomed right figure; arrow shows Tg+ EGFP- follicle). Scale bars: 100 µm and 20 µm (zoom).

