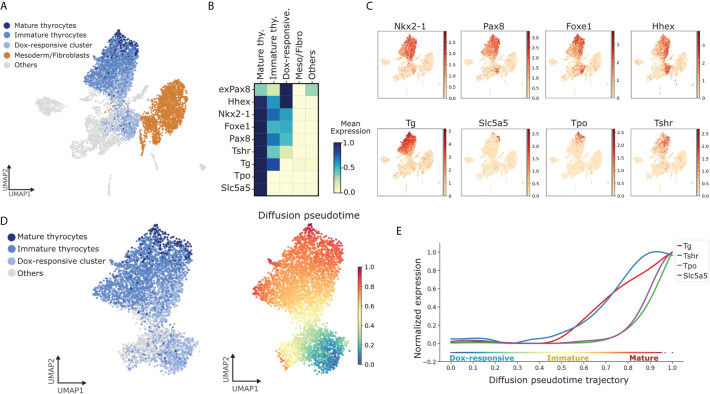
Figure 3.
Identification of pathways dynamically regulated during TFCs maturation. (A) UMAP displaying subclusters within the thyroid lineage (Dox-responsive cluster, immature and mature thyrocytes). Remaining cells are labeled as ‘Others’. (B) Gene-expression matrix plot for thyroid markers: exPax8, Hhex, Nkx2-1, Foxe1, Pax8, Tshr, Tg, Tpo, Nis/Slc5a5 in subclusters of thyroid lineage and other cell groups. Color intensity in each square represents mean expression in the corresponding cluster. (C) UMAP overlaid with gene expression plots for thyrocyte markers. Color indicates normalized expression. (D) Diffusion pseudotime analysis of thyrocyte lineage. (Left) UMAP displaying the subclusters within the thyroid lineage; (Right) UMAP overlaid with pseudotime. Color in the pseudotime plot indicates the ordering of the cells. (E) Expression trends of thyroid differentiation markers along pseudotime trajectory.

