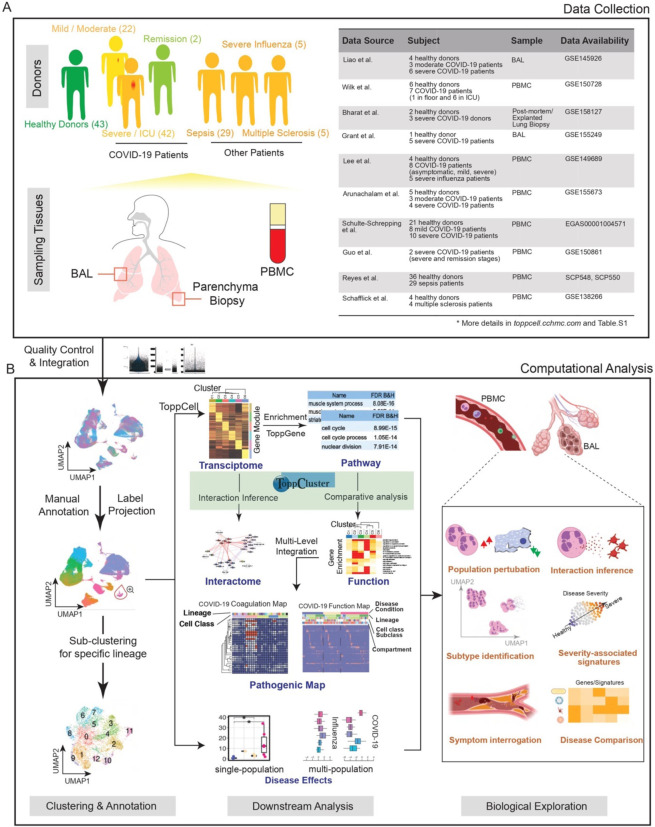
Fig. 1. Creating a COVID-19 Signature Atlas.
(A) Representative aggregation of multiple single-cell RNA-sequencing datasets from COVID-19 and related studies. The present study is derived from a total of 231,800 peripheral blood mononuclear cells (PBMCs), 101,800 bronchoalveolar lavage (BAL) cells and 146,361 lung parenchyma cells from 43 healthy; 22 mild, 42 severe, and 2 convalescent patients. Data was collated from eight public datasets (right). (B) Data analysis pipeline of the study using Topp-toolkit. It includes three phases: (1) clustering and annotation; (2) downstream analysis using Topp-toolkit; (3) biological exploration. Output includes the evaluation of abundance of cell populations, cell type (cluster) specific gene modules, functional associations of disease-associated cell classes and clusters, inference of cell-cell interactions, as well as comparative analysis across diseases, including influenza, sepsis and multiple sclerosis. Additional newer datasets not included in this manuscript are present and will continue to be added to ToppCell (http://toppcell.cchmc.org).

