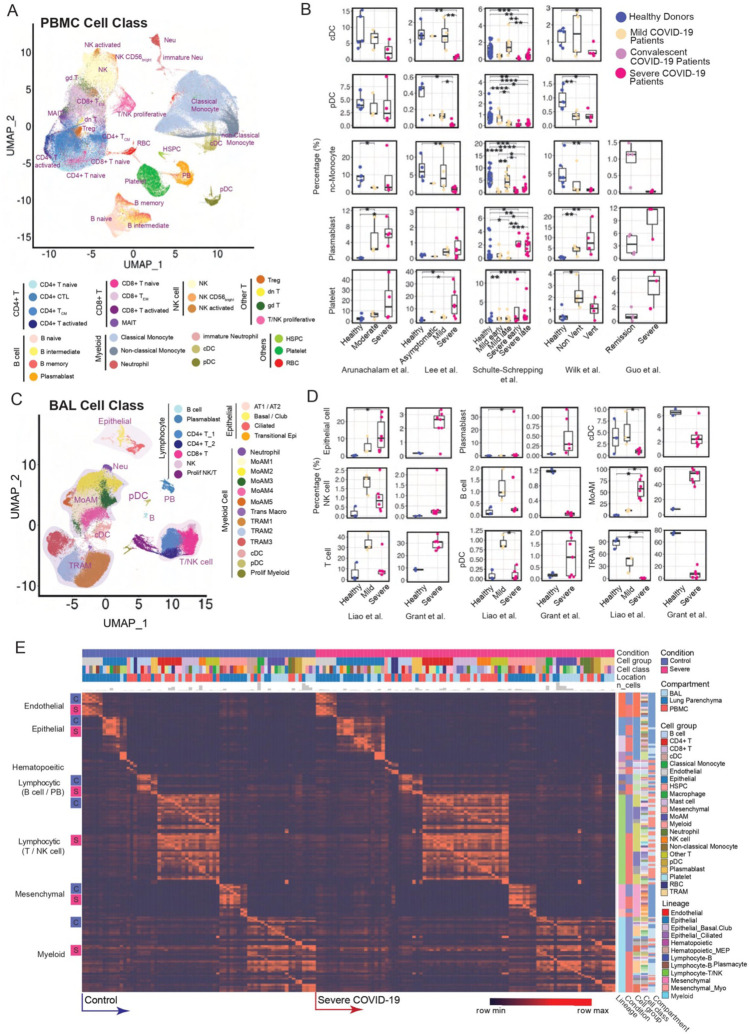
Fig. 2. Modularized representation of cell type specific gene signatures and dynamic changes of cell abundance.
(A) Uniform Manifold Approximation and Projection (UMAP) of 28 distinct cell types identified in the integrated peripheral blood mononuclear cell (PBMC) data. (B) Comparative analysis of cell abundance effects of COVID-19. Reproducible multi-study data present high impact effects on 5 cell types in PBMC. Percentages of selected cell types in each sample are shown (where Vent: Ventilated patients; Non Vent: Non-ventilated patients). Significance between two conditions was measured by the Mann-Whitney rank sum test (Wilcoxon, paired=False), which was also used in following significance tests of cell abundance changes in this study. *: p <= 0.05; **: p <= 0.01; ***: p <= 0.001; ****: p <= 0.0001. (C) UMAP of 24 distinct cell types identified in the integrated BAL data. (D) Dynamic changes of cell abundances for cell types in two bronchoalveolar lavage (BAL) single-cell datasets. (E) ToppCell allows for gene signatures to be hierarchically organized by lineage, cell type, subtype, and disease condition. The global heatmap shows gene modules with top 50 upregulated genes (student t test) for each cell type in a specific disease condition and compartment. Gene modules from control donors and severe COVID-19 patients were included in the figure.

