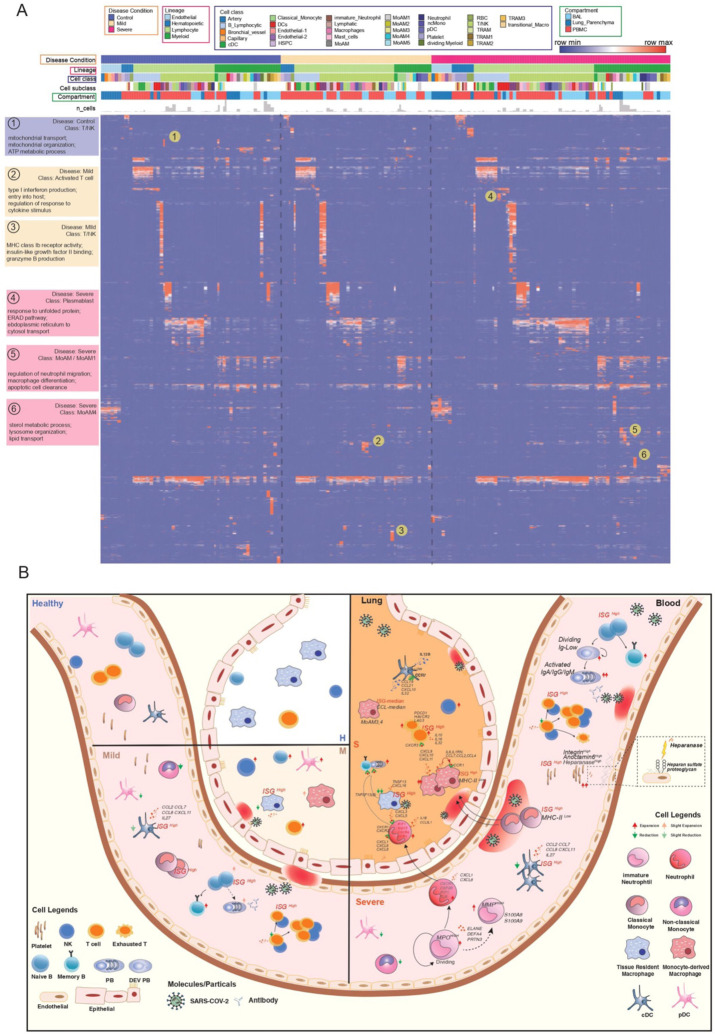
Fig. 6. Comparative analysis of cell type specific gene signatures associated with lineage, class, subclass, compartment, and disease state in the COVID-19 atlas.
(A) Enrichment scores of gene modules for all cell types across different compartments and COVID-19 conditions were generated by ToppCluster and shown on the heatmap. ToppCluster enriched functions from Gene Ontology, Human Phenotype, Mouse Phenotype, Pathway and Interaction databases were used to generate a feature matrix (cell types by features) and hierarchically clustered. Hot spots of the disease-specific enrichments were highlighted and details were shown on the left. More details can be found in Methods. (B) Summarizing predicted functions and interplay of immune cells in COVID-19 blood and lung. Aforementioned key observations in this study were shown in peripheral blood mononuclear cells (PBMC) and bronchoalveolar lavage (BAL) in healthy donors, mild and severe COVID-19 patients, including changes of cell abundance, specific marker genes, upregulated secretion, cell development and cell-cell interactions.

