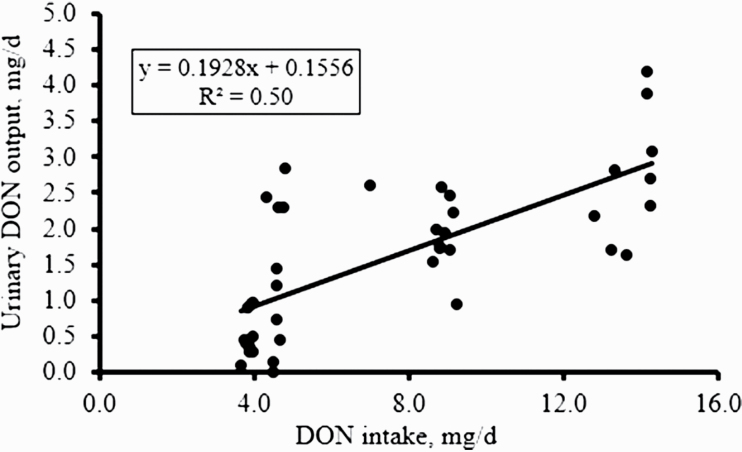
Figure 3.
Regression analysis of the relationship between deoxynivalenol (DON) intake and DON output in urine (n = 10 pigs per treatment). The urine samples were collected during the nitrogen balance period of the experiment over 24 h and analyzed for DON content. Data are expressed as the DON intake per day (mg/d) and the urine DON output (mg/d) and the coefficient of determination (R2) of the regression curve is 0.50 at P < 0.05.

